A Alpha Hpa Limited
ASX:A4N
Australia
380
How Does Alpha Hpa's Technological Strides Revolutionize Aluminium Production?
 ASX:A4N
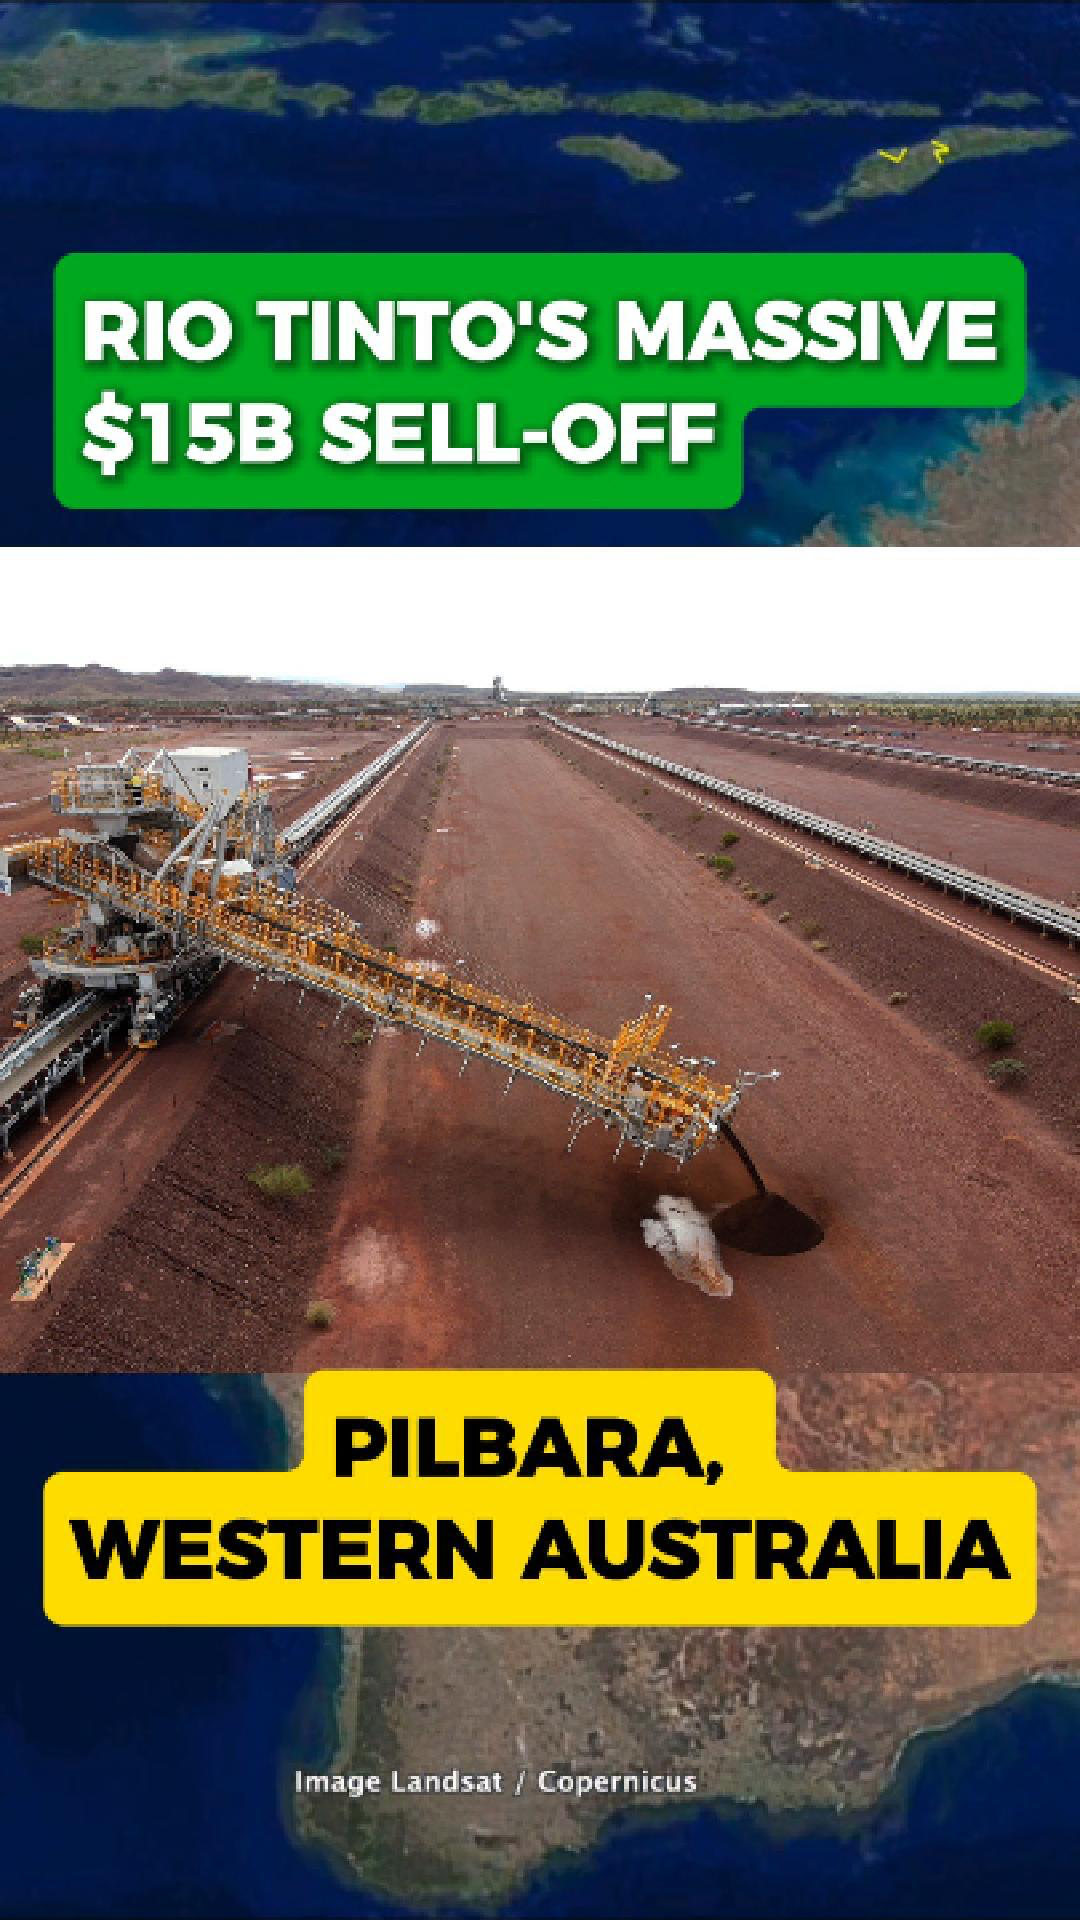
Rio Tinto Launches $15 Billion Asset Sell-Off
Rio Tinto Has Announced Plans To Sell Up To $15 Billion Worth Of Assets As Part Of A Strategy To Streamline The Company And Refocus On Its Core Operations. The Move Marks One Of The Largest Portfolio Resets In The Miner’S History.
Iron Ore Still The Backbone
At Tom Price In Western Australia’S Pilbara Region, Iron Ore Is Moved By Rail Almost 400 Kilometres To Cape Lambert, Where It Is Loaded Onto Ships Bound For Asia. These Pilbara Mines Remain Rio’S Strongest Earnings Driver And Will Not Be Part Of The Sell-Off.
What Will Be Sold?
Rio Plans To Offload Non-Core Mines, Land Parcels, And Parts Of Its Processing And Infrastructure Portfolio. The Company Is Also Reducing Spending On Decarbonisation Projects, Shifting Towards Third-Party Partnerships Instead Of Funding Major Energy Investments Itself.
Simandou Adds Global Pressure
The Timing Of The Reset Coincides With The Long-Awaited Ramp-Up Of The Simandou Iron Ore Project In Guinea, Which Will Introduce New Global Supply. The Added Competition Has Intensified Rio’S Push To Sharpen Its Business And Strengthen Financial Performance.
A High-Stakes Strategy
Rio Says The Changes Will Make The Company “Stronger, Sharper And Simpler.”
But With Iron Ore Markets Shifting And New Supply Emerging, The Key Question Remains: Will Selling Too Much Reduce Rio’S Long-Term Advantage?
ASX:RIO
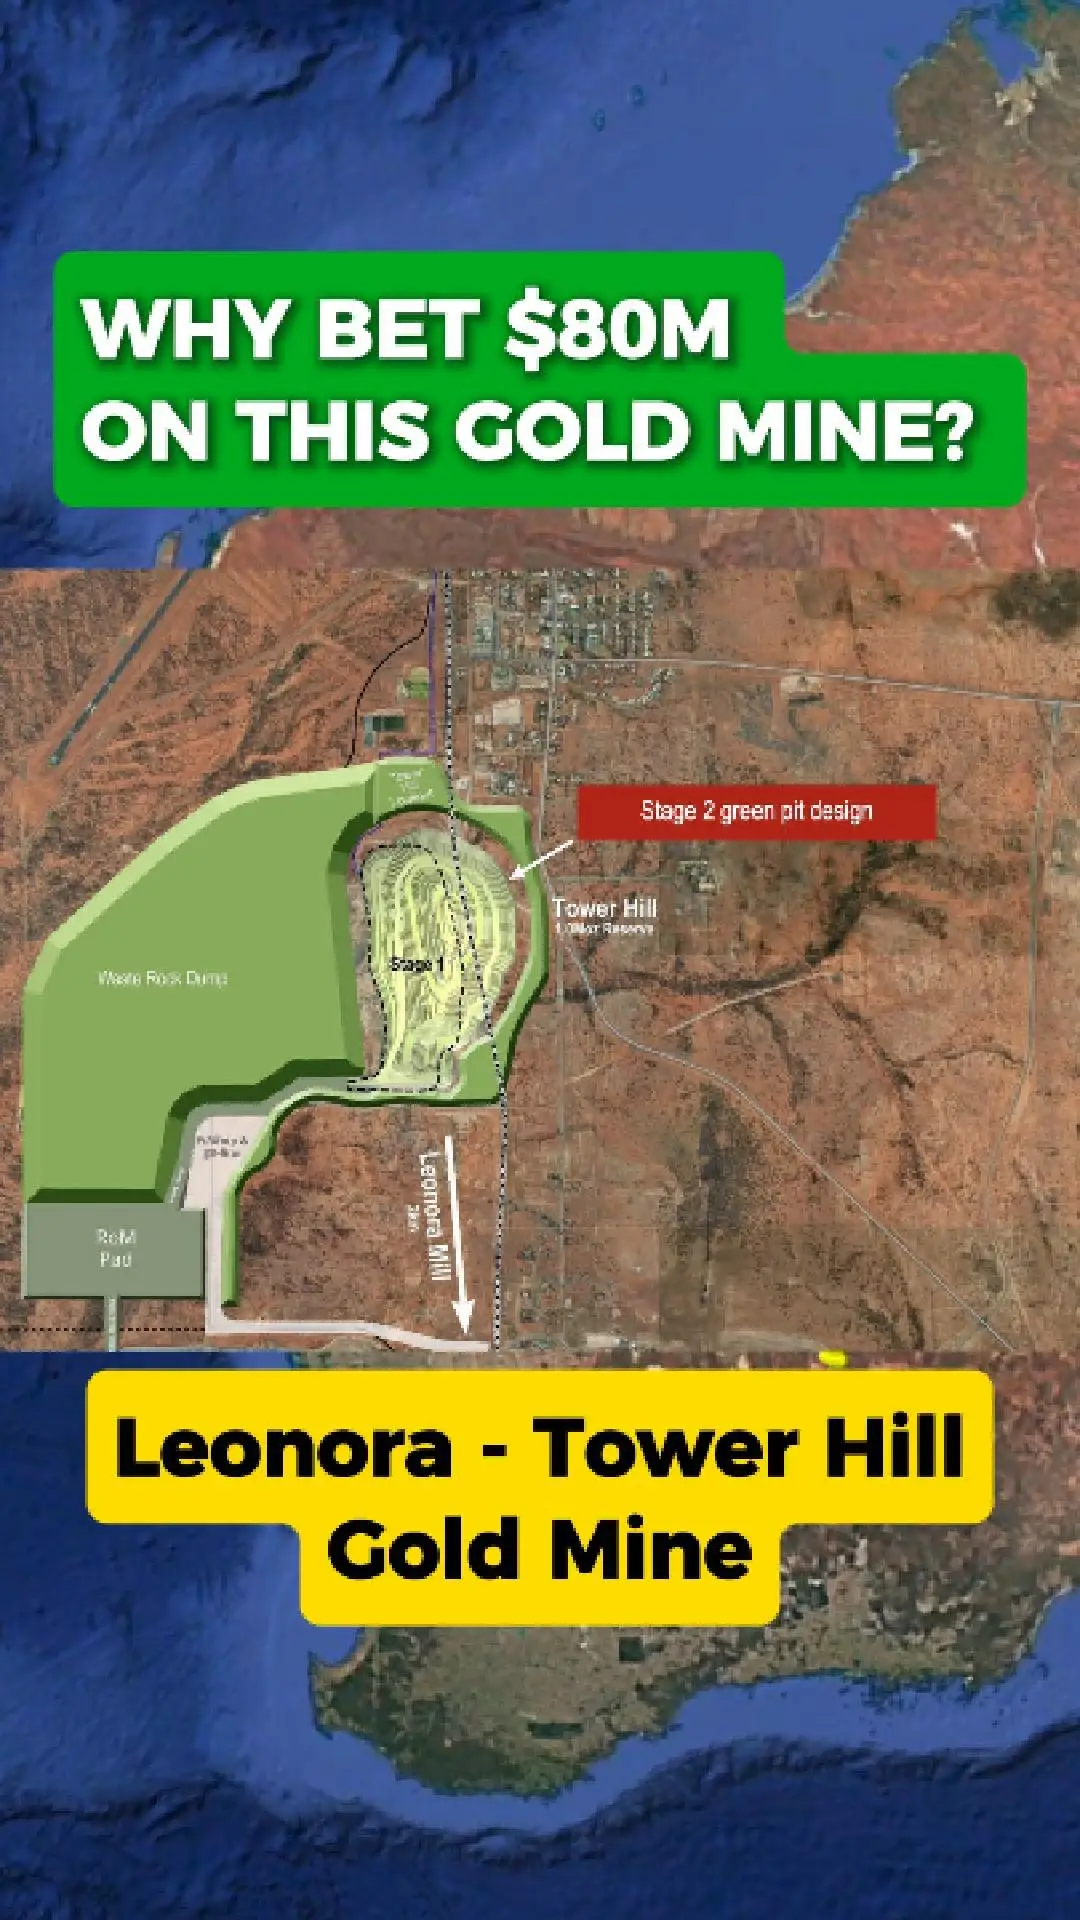
Why Bet $80 Million On This Gold Mine?
Genesis Minerals Is Accelerating Work At Tower Hill — A Major Gold Deposit Just Outside Leonora In Western Australia — As The Company Moves Closer To Full-Scale Development. With Gold Prices Trading Near Record Highs, The Project Has Quickly Become One Of Wa’S Most-Watched Growth Stories.
Shifting The Rail To Unlock The Pit
One Of The Most Significant Steps Is The Plan To Relocate The Nearby Rail Line. This Allows Genesis To Expand The Mill And Open Up The Full Extent Of The Tower Hill Pit — Something Previous Owners Couldn’T Realistically Do. The Move Clears The Way For A Larger, More Efficient Operation Tied Directly Into Genesis’ Leonora Production Hub.
High-Grade Hits Continue
Recent Drilling Around Tower Hill Has Returned Consistent High-Grade Intercepts, Strengthening Confidence In The Resource And Supporting Plans For A Much Larger Mine Footprint. These Results Also Feed Into An Expanded Underground Study Now Underway.
A New Gold Hub In The Making?
With Planned Capital Spending Around The $80 Million Mark, A Strong Gold Market, And A District-Scale Strategy Connecting Multiple Deposits, Investors Are Watching Closely. If The Development Plan Lands As Expected, Tower Hill Could Become Wa’S Next Major Gold Success Story — And A Key Pillar In Genesis Minerals’ Leonora Growth Plans.
ASX:GMD
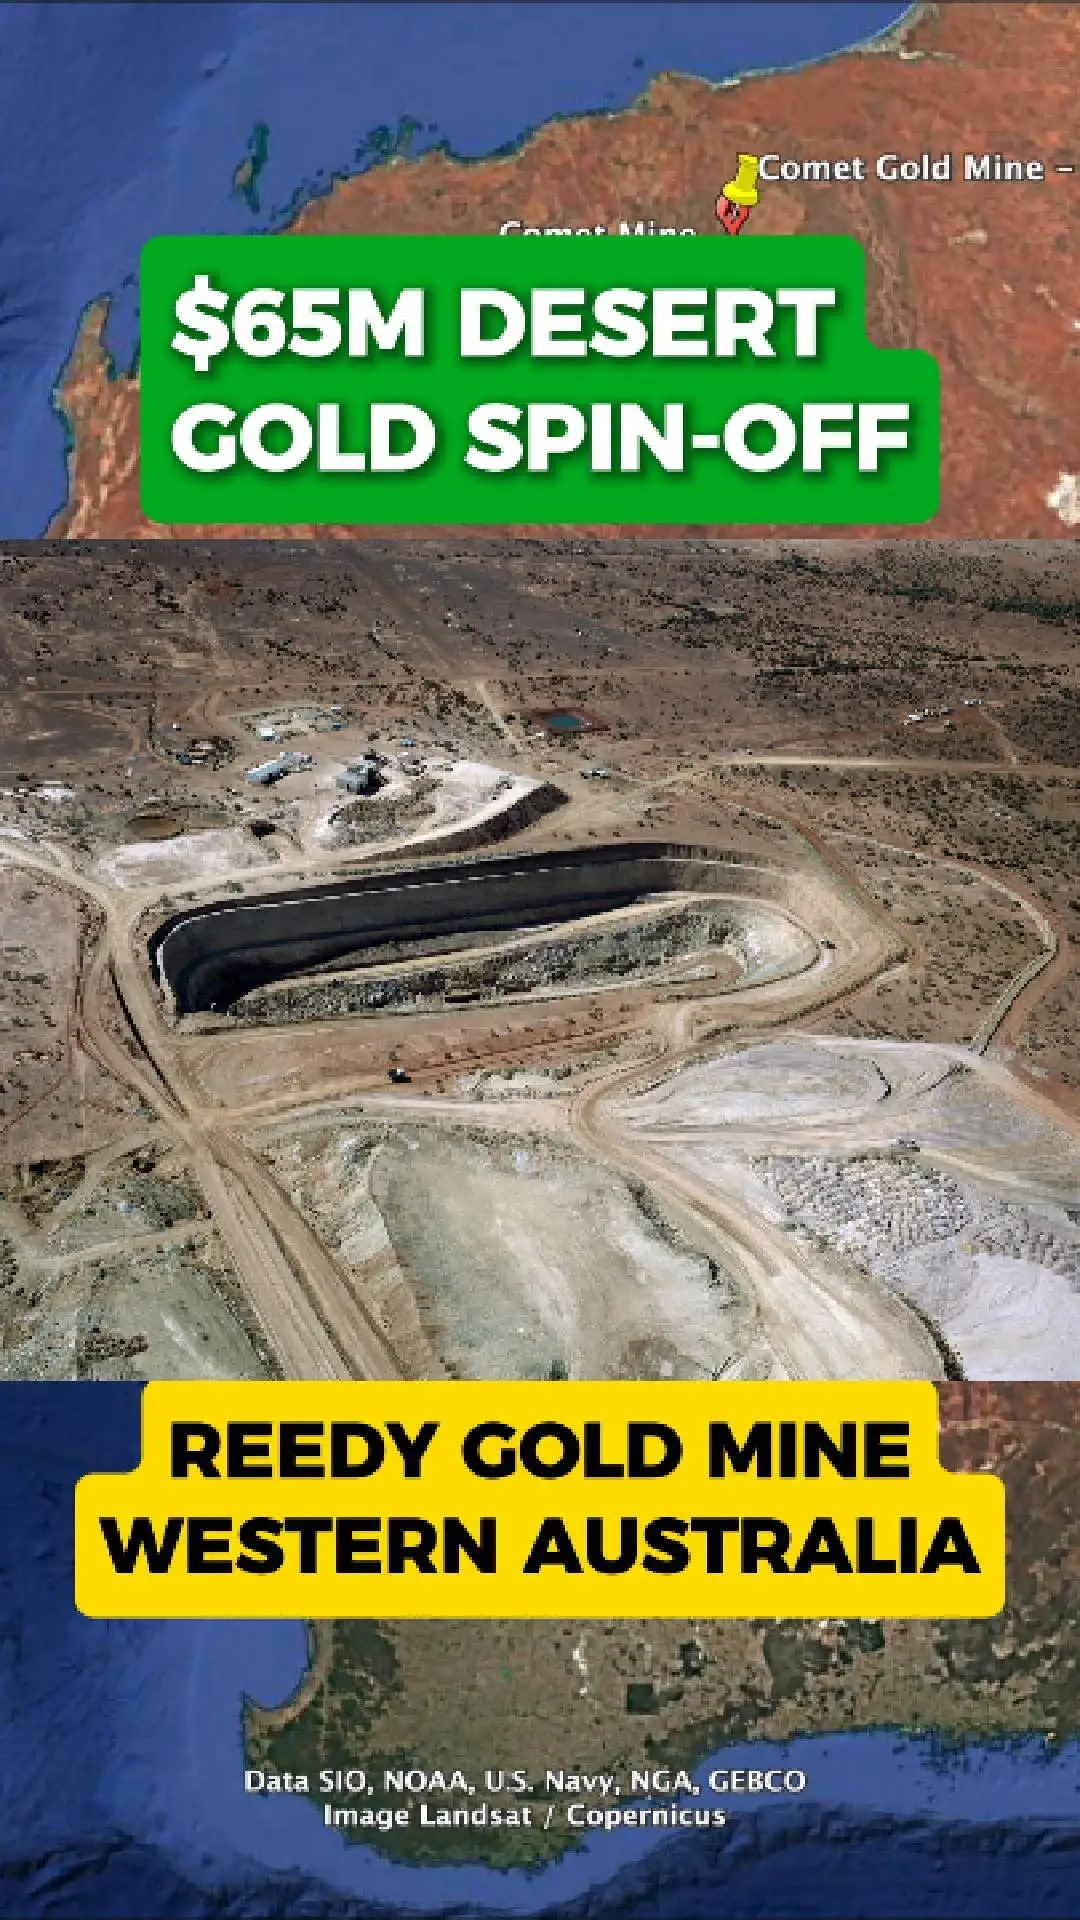
Reedy Gold Mine Set For New Chapter
The Old Reedy Gold Mine In Western Australia Is Set To Get A Second Chance, Following A Major Corporate Restructure By Westgold Resources.
Westgold Has Announced Plans To Spin Out The Reedy Project, Along With The Nearby Comet Project, Into A New Asx-Listed Company Called Valiant Gold.
Fast Track To Processing
Under The Proposed Structure, Ore From Reedy And Comet Will Be Processed At Westgold’S Existing Plants. This Removes The Need For Valiant To Build Its Own Processing Facilities, Providing A Lower-Capital And Faster Pathway Back To Gold Production.
The Reedy And Comet Assets Include Historic Underground Mines With Recent Production History And Established Infrastructure.
Westgold Retains Exposure
Following The Spin-Off And Ipo, Westgold Will Retain Up To 48 Per Cent Of The New Company. This Allows Westgold To Stay Exposed To Any Upside From Future Production Or Exploration Success, While Focusing Its Capital On Larger, Core Operations.
Unlocking Smaller Gold Assets
The Spin-Out Structure Is Designed To Unlock Value From Smaller Gold Assets That May Struggle To Compete For Capital Within A Larger Producer.
With A Dedicated Management Team And Access To Processing Infrastructure, Valiant Gold Is Positioned To Advance Reedy And Comet Independently — Raising The Question Of Whether This Model Could Become A Blueprint For Reviving Other Historic Gold Mines Across Western Australia.
ASX:WC8
Poll
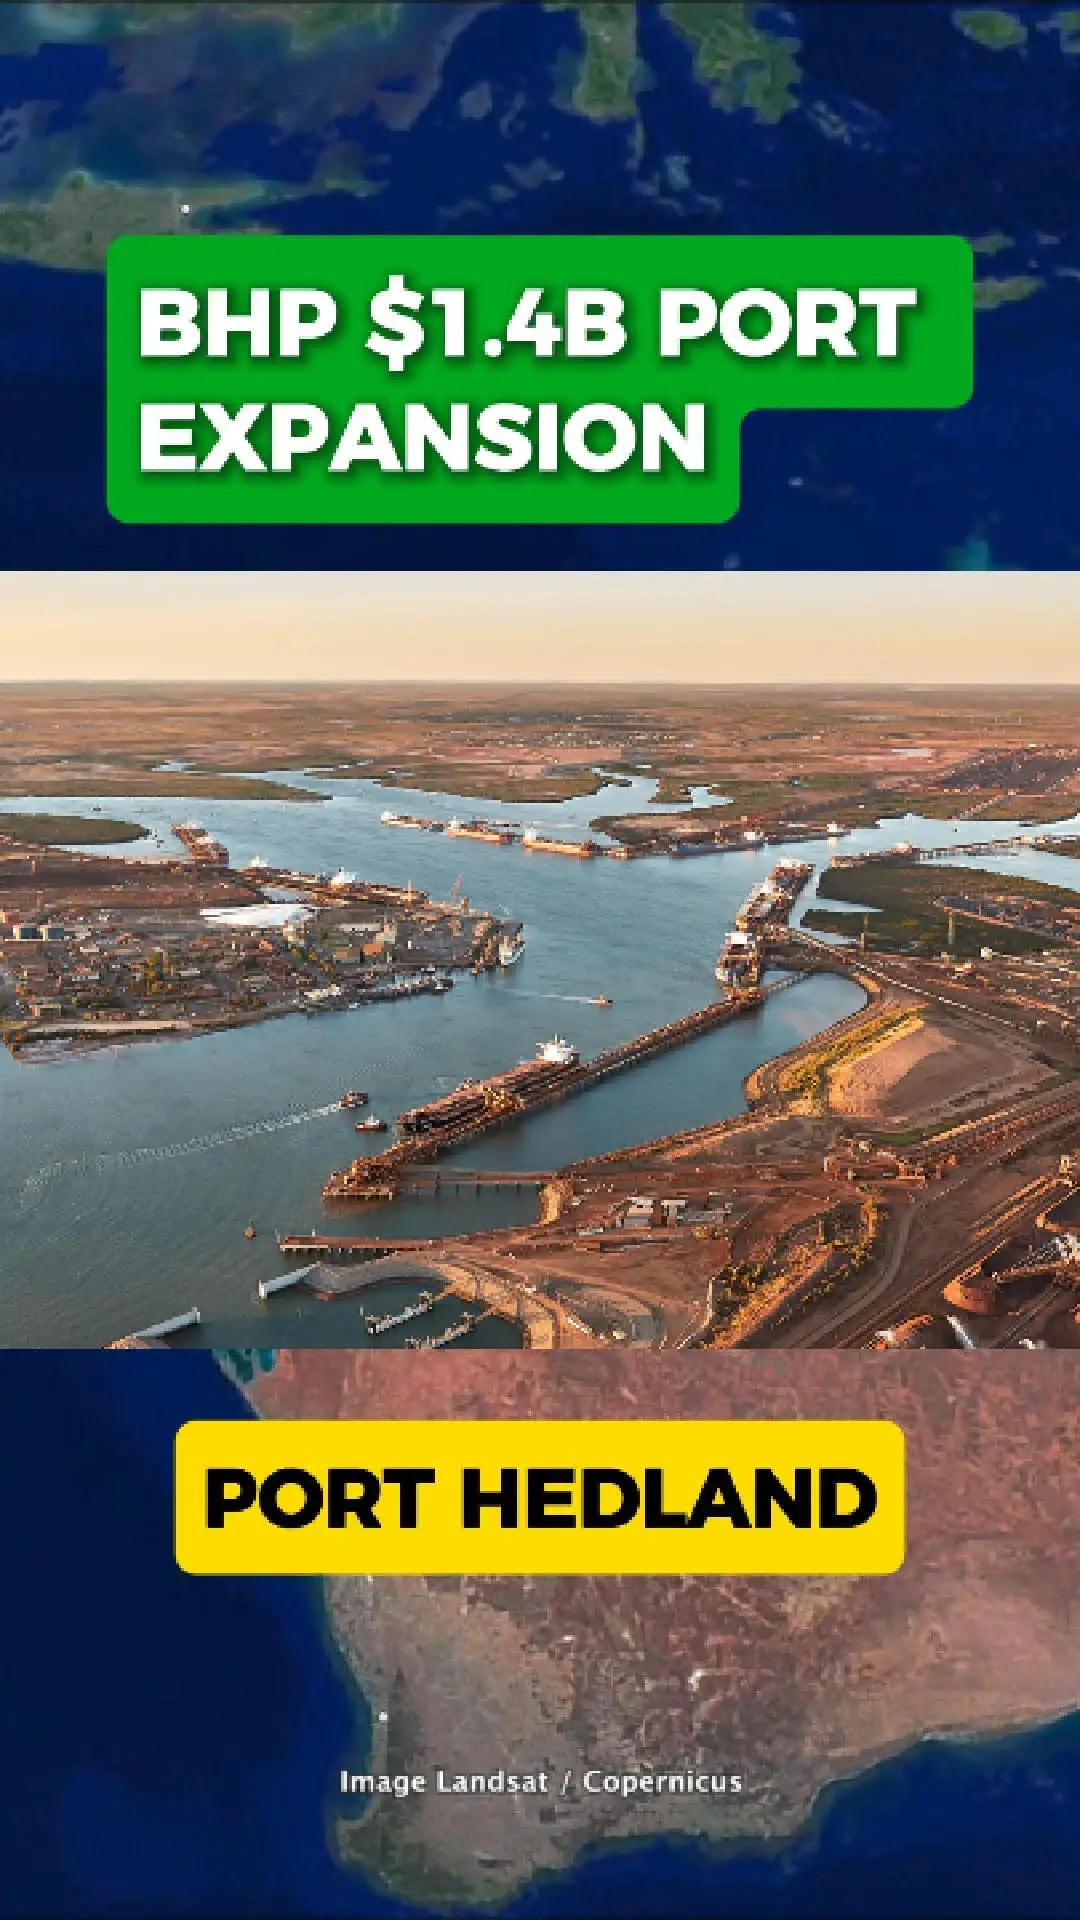
Bhp’S $1.4 Billion Push To Lift Port Hedland Capacity
Bhp Is Investing $1.4 Billion To Upgrade Infrastructure At Port Hedland, The World’S Largest Bulk Export Port And The Backbone Of Australia’S Iron-Ore Industry.
This Port Handles The Ore That Arrives From Bhp’S Giant Pilbara Mines — Brought In By Some Of The Longest Freight Trains On Earth. With Global Demand Rising And Competition Heating Up, Bhp Is Preparing The Port For Its Next Phase Of Growth.
New Rail-Car Dumper And 5km Conveyors
The Major Upgrade Includes:
A New Sixth Rail-Car Dumper
Around Five Kilometres Of New Conveyors
Upgrades To Screening And Transfer Infrastructure
These Additions Are Designed To Move Ore From Train To Ship Faster, Safer And With Fewer Bottlenecks, Supporting Bhp’S Long-Term Target Of 305 Million Tonnes Per Year.
A Strategic Response To Rising Competition
Bhp’S Investment Comes As Rio Tinto And Chinese-Backed Groups Expand Operations In Africa, Including Major New Iron-Ore Developments In Guinea.
Those Projects Could Shift Global Supply Balances Over The Next Decade. Increasing Throughput At Port Hedland Is Part Of Bhp’S Effort To Maintain Its Position As A Leading Low-Cost Iron-Ore Producer.
Is It Enough To Stay Ahead?
The Expansion Will Boost Efficiency And Help Stabilise Output Across Bhp’S Pilbara Network. But With New African Mines Edging Closer And Long-Term Demand Uncertain, The Question Remains:
Will This $1.4 Billion Upgrade Secure Bhp’S Lead — Or Will More Investment Be Needed To Stay In Front?
ASX:BHP
Popular Stocks 🚀
Show more