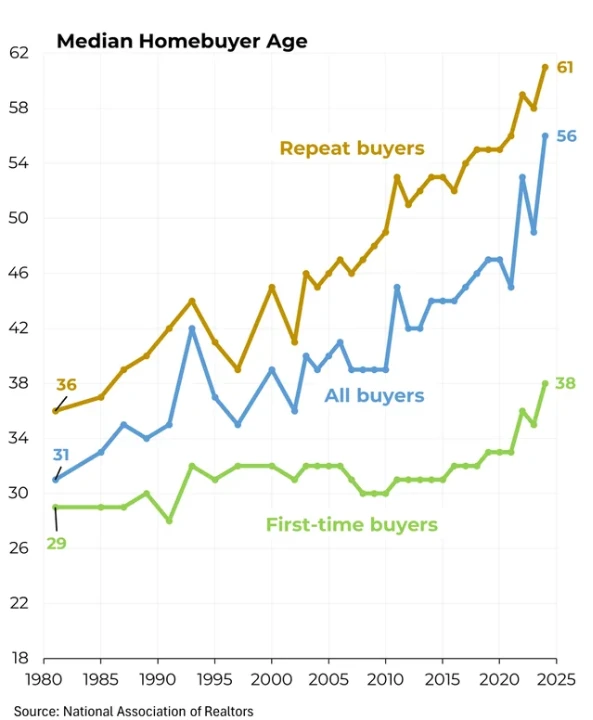
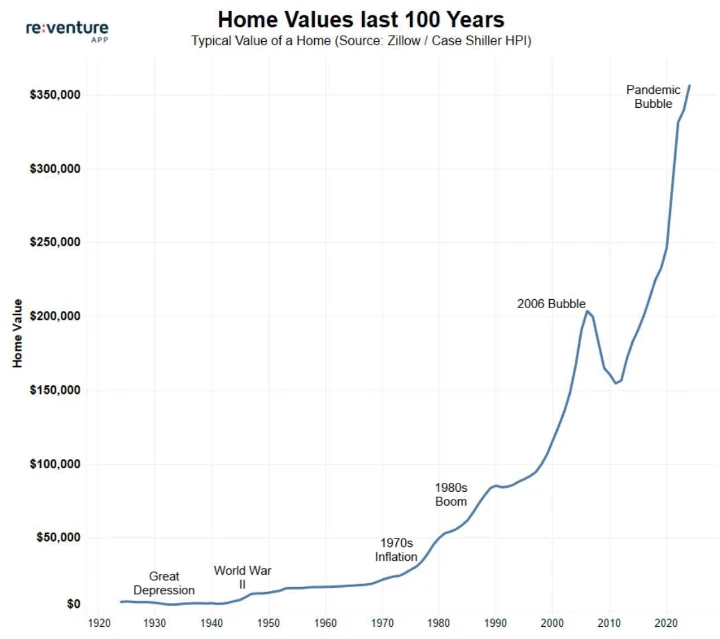
Between 2008 and 2020 surely was the easiest time to bu houses, it's not even close. Not only did prices collapse after the GFC, but interest rates were near zero and super easy to get loans
ADRIATIC METALS PLC Chat
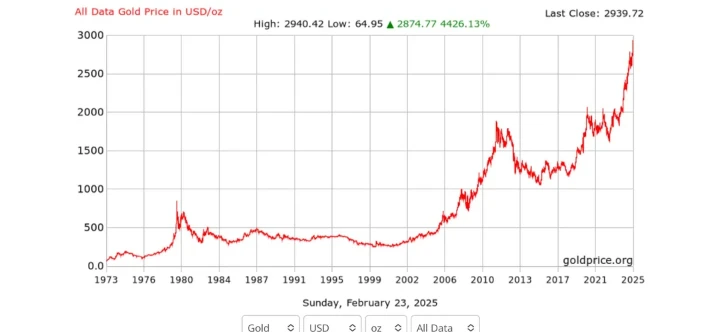
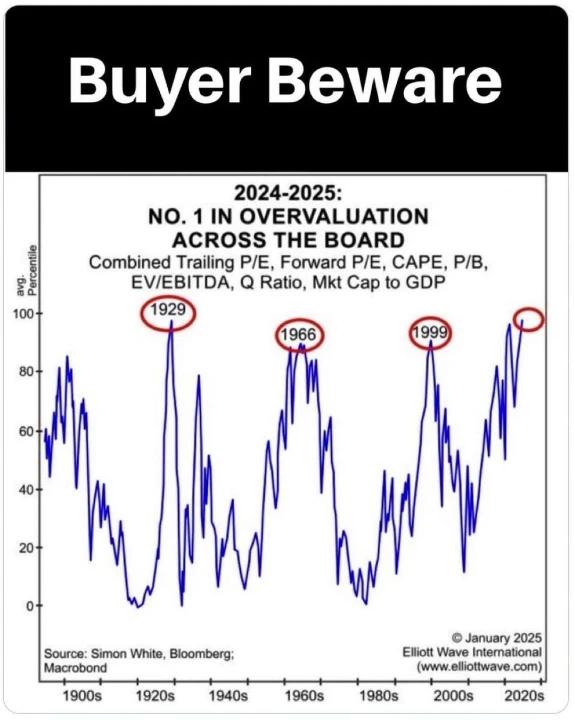
Man this stuff just keeps getting higher and higher... where's the peak or is it all just completely overblown doom and gloom propaganda?
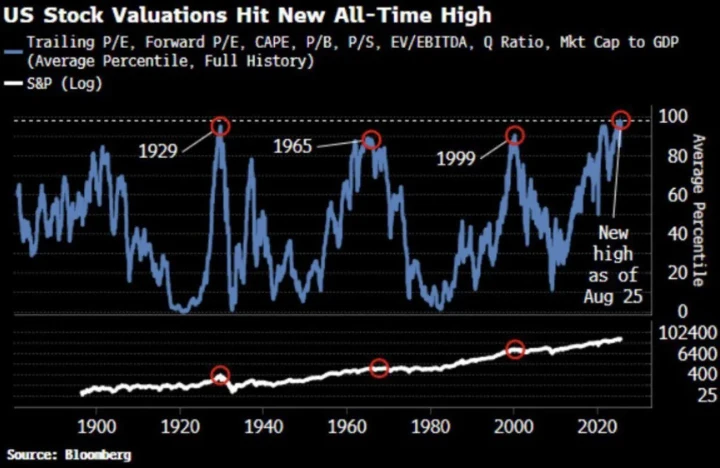
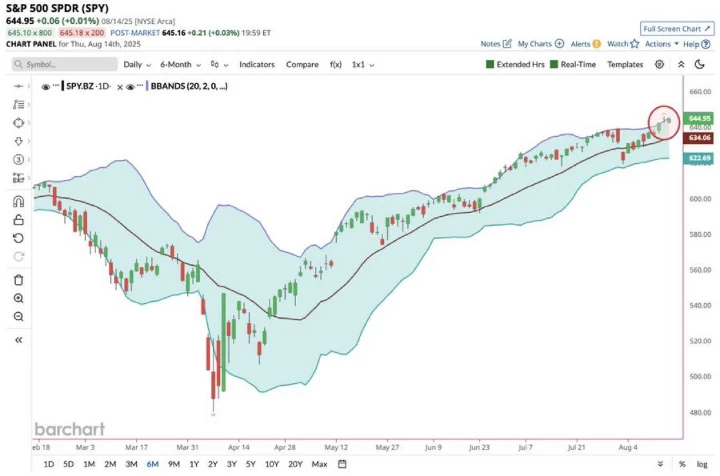
SPY is hitting highs, wonder what comes next, maybe a setup into the usual sell off's in September through October perhaps, food for thought, dyor
A Adriatic Metals Plc
ASX:ADT
Australia
Revenue: 27.6m
$0.0/sec