A Ardea Resources Limited
ASX:ARL
Australia
340
Ardea Resources Acquires Tenements In Kalgoorlie Nickel Project
 ASX:ARL
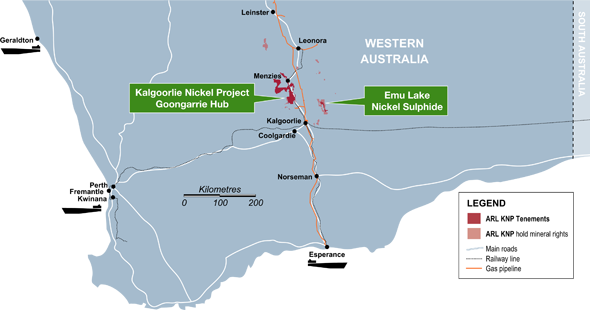
Ardea Resources Signs Mou With Japanese Consortium To Develop Kalgoorlie Nickel Project
ASX:ARL
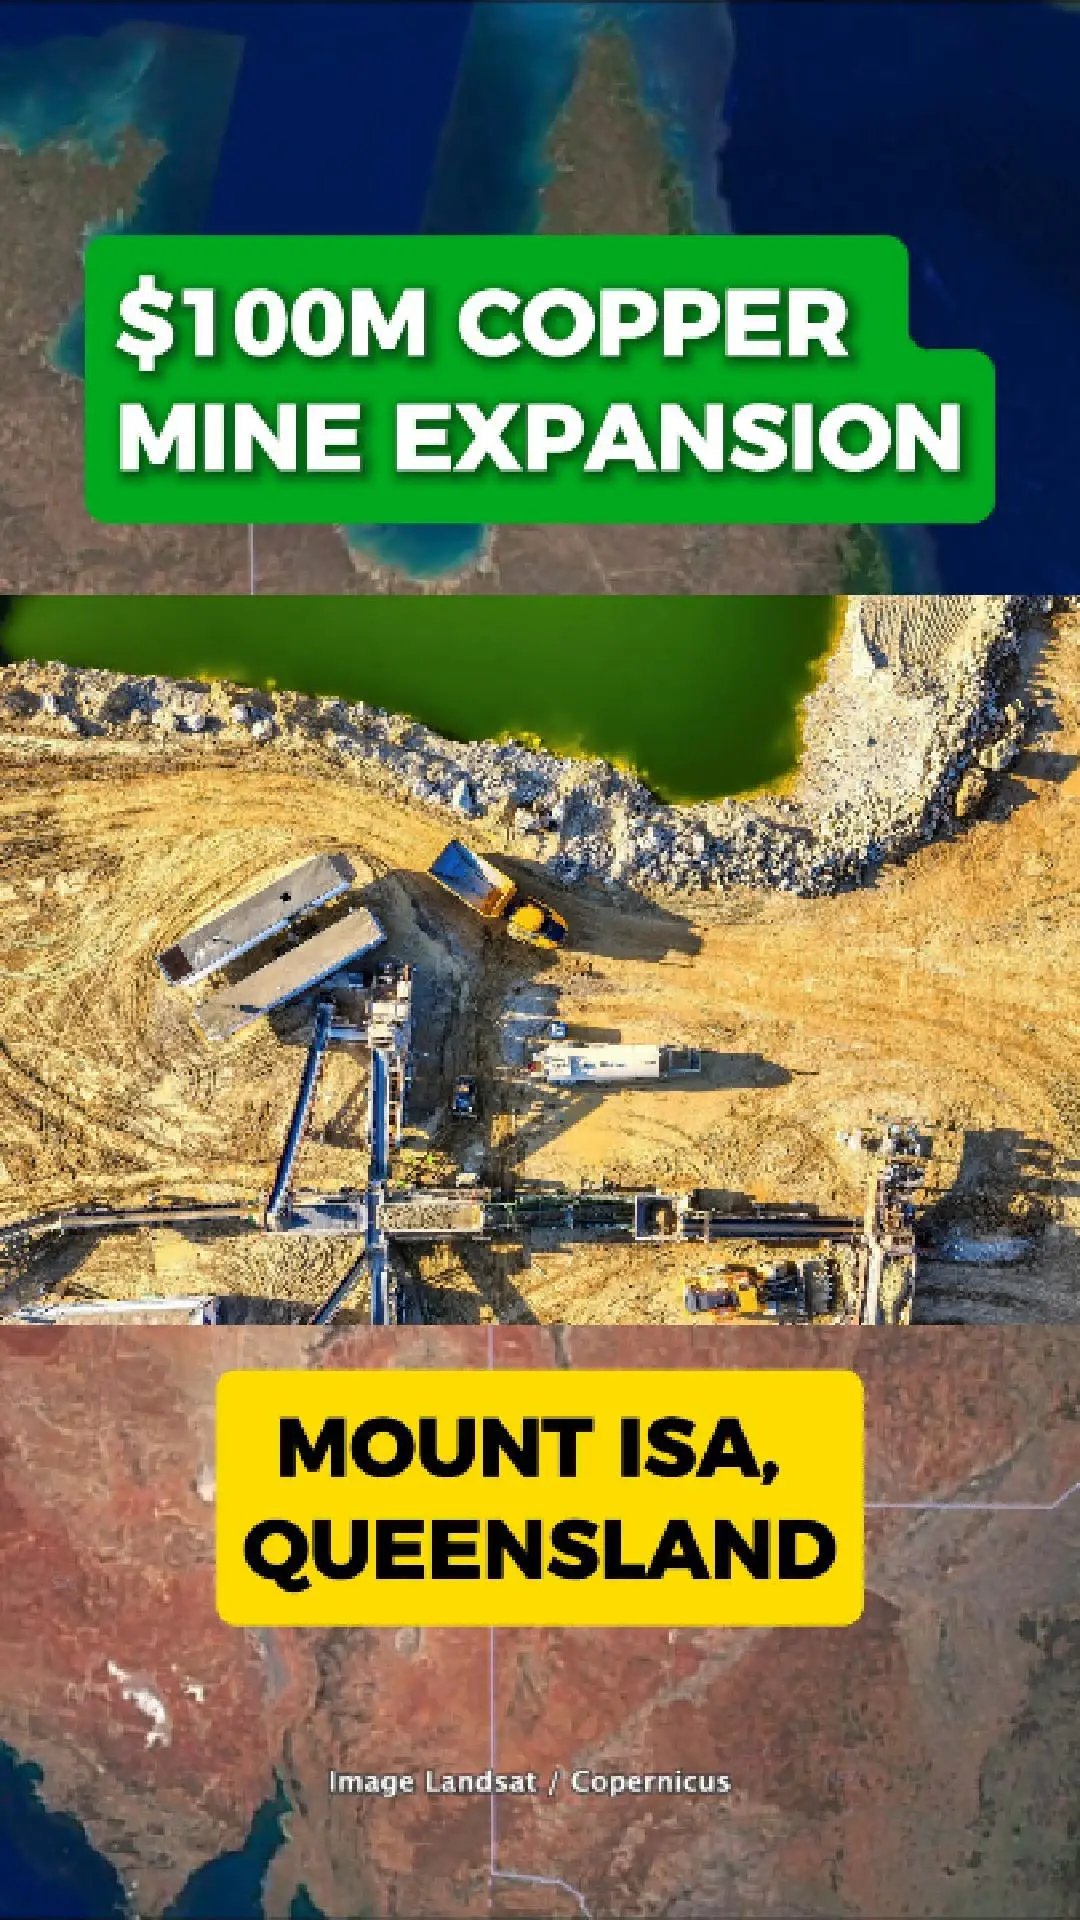
$100 Million Plan To Boost Copper Output In North Queensland
Major Upgrade At Eloise Mine
Aic Mines Is Investing Around $100 Million Into Expanding The Eloise Copper Mine, Located South-East Of Mount Isa In North Queensland. The Project Aims To Modernise The Older Underground Operation And Bring New Life To The Site.
Jericho Deposit Set To Drive Growth
A Key Part Of The Plan Is The Development Of The Nearby Jericho Deposit. Once Opened, Jericho Is Expected To Send About 600,000 Tonnes Of Ore Each Year Into Eloise’S Processing Plant.
Bigger Plant, Bigger Production
To Handle The Extra Ore, Aic Mines Is Expanding The Processing Plant To 1.1 Million Tonnes A Year. Together, The Eloise And Jericho Operations Could Produce Around 20,000 Tonnes Of Copper Annually, Creating A New Copper Hub In The Mount Isa Region.
A Potential Boost For Queensland’S Copper Belt
With Global Demand For Copper Growing, The Combined Project Could Become A Significant Contributor To The State’S Critical Minerals Industry.
Whether This $100 Million Move Sparks Queensland’S Next Copper Boom Remains To Be Seen, But It Marks A Major Step For Aic Mines And The Region’S Mining Future.
ASX:A1M
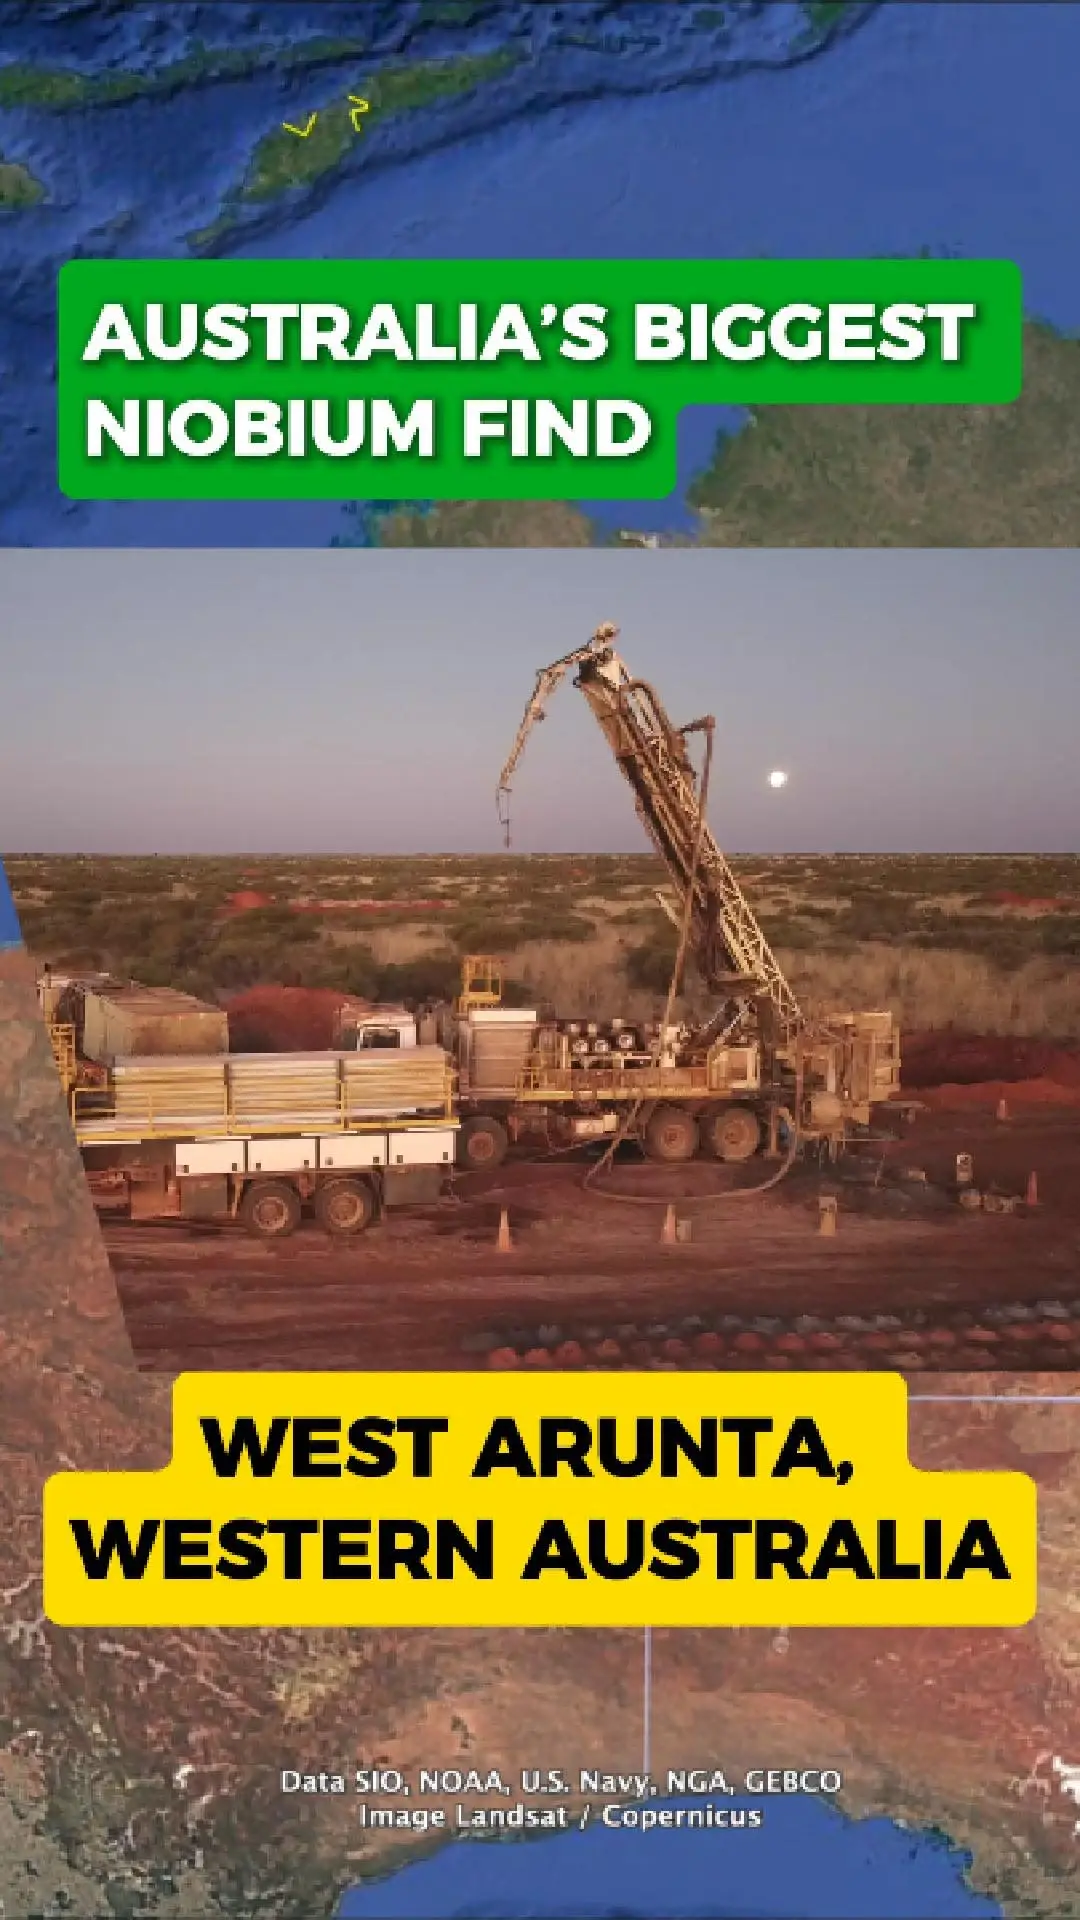
Australia Fast-Tracks Major Niobium Discovery
One Of The World’S Most Significant Niobium Discoveries Is Now Being Pushed Forward In Remote Western Australia, After The Federal Government Granted Major Project Status To Wa1 Resources’ Luni Project.
Located In The West Arunta Region, The Project Contains Over 200 Million Tonnes Of High-Grade Niobium- And Phosphorus-Rich Material — Described By Wa1 As The Biggest Niobium Discovery In 70 Years.
Why Niobium Matters
Niobium Is A Strategic Critical Mineral Used To Strengthen High-Performance Steel, Particularly In Pipelines, Automotive Components And Major Construction.
It Is Also Essential In Jet Engine Superalloys, Superconducting Magnets, Electronics, And Other Advanced Technologies.
The Scale Of Luni Gives Australia A Rare Opportunity To Expand Its Role In The Global Supply Of This Specialised Metal, Which Is Currently Dominated By Brazil.
A Key Step In Strengthening Supply Chains
The Major Project Status Designation Signals Canberra’S View Of Luni As A Development With National Economic And Strategic Importance.
Wa1 Says The Recognition Highlights Luni’S Potential To Support Regional Jobs, Bolster Sovereign Capability, And Contribute To Australia’S Growing Critical-Minerals Export Sector.
As Studies Progress, Luni Is Shaping Up As One Of The Country’S Most Important New Mineral Projects — And A Rare Moment Of Global Significance For The Niobium Industry.
ASX:WA1
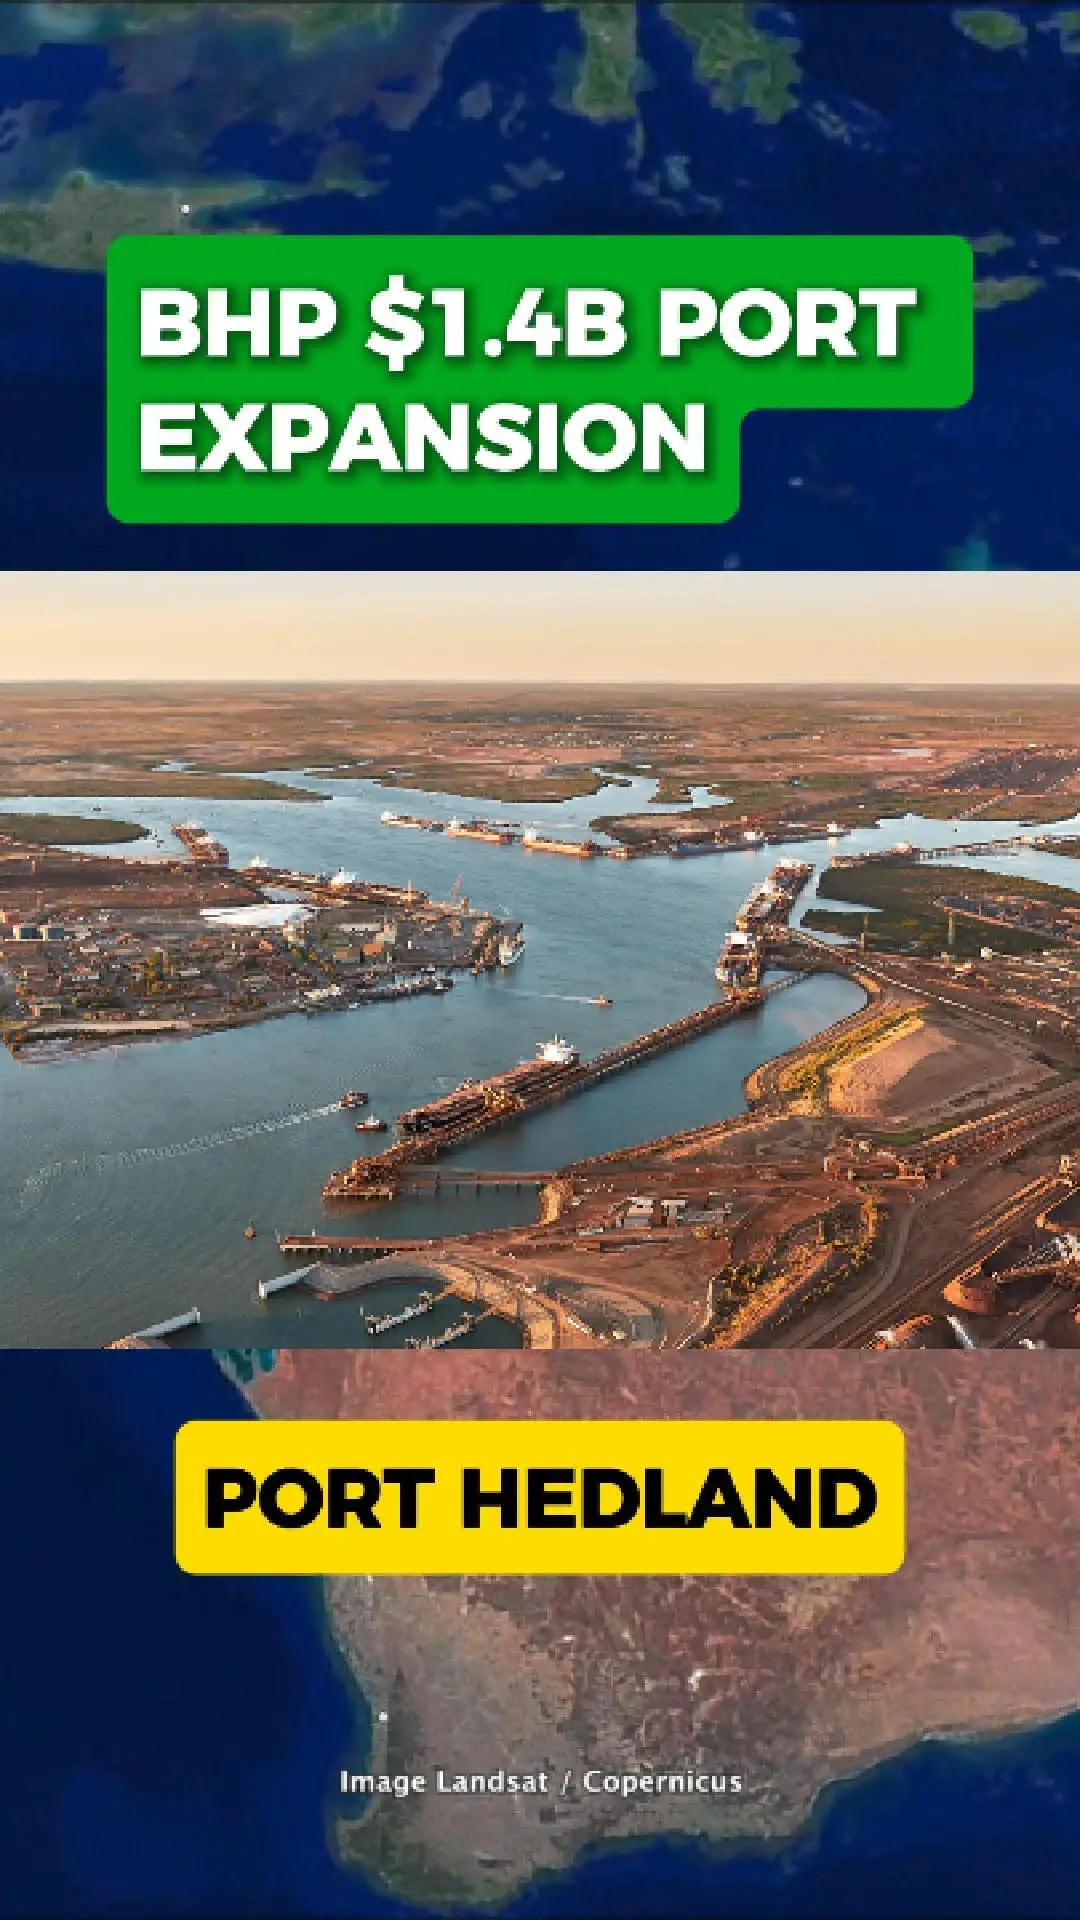
Bhp’S $1.4 Billion Push To Lift Port Hedland Capacity
Bhp Is Investing $1.4 Billion To Upgrade Infrastructure At Port Hedland, The World’S Largest Bulk Export Port And The Backbone Of Australia’S Iron-Ore Industry.
This Port Handles The Ore That Arrives From Bhp’S Giant Pilbara Mines — Brought In By Some Of The Longest Freight Trains On Earth. With Global Demand Rising And Competition Heating Up, Bhp Is Preparing The Port For Its Next Phase Of Growth.
New Rail-Car Dumper And 5km Conveyors
The Major Upgrade Includes:
A New Sixth Rail-Car Dumper
Around Five Kilometres Of New Conveyors
Upgrades To Screening And Transfer Infrastructure
These Additions Are Designed To Move Ore From Train To Ship Faster, Safer And With Fewer Bottlenecks, Supporting Bhp’S Long-Term Target Of 305 Million Tonnes Per Year.
A Strategic Response To Rising Competition
Bhp’S Investment Comes As Rio Tinto And Chinese-Backed Groups Expand Operations In Africa, Including Major New Iron-Ore Developments In Guinea.
Those Projects Could Shift Global Supply Balances Over The Next Decade. Increasing Throughput At Port Hedland Is Part Of Bhp’S Effort To Maintain Its Position As A Leading Low-Cost Iron-Ore Producer.
Is It Enough To Stay Ahead?
The Expansion Will Boost Efficiency And Help Stabilise Output Across Bhp’S Pilbara Network. But With New African Mines Edging Closer And Long-Term Demand Uncertain, The Question Remains:
Will This $1.4 Billion Upgrade Secure Bhp’S Lead — Or Will More Investment Be Needed To Stay In Front?
ASX:BHP
Poll
Popular Stocks 🚀
Show more