B Black Cat Syndicate Limited
ASX:BC8
Australia
400
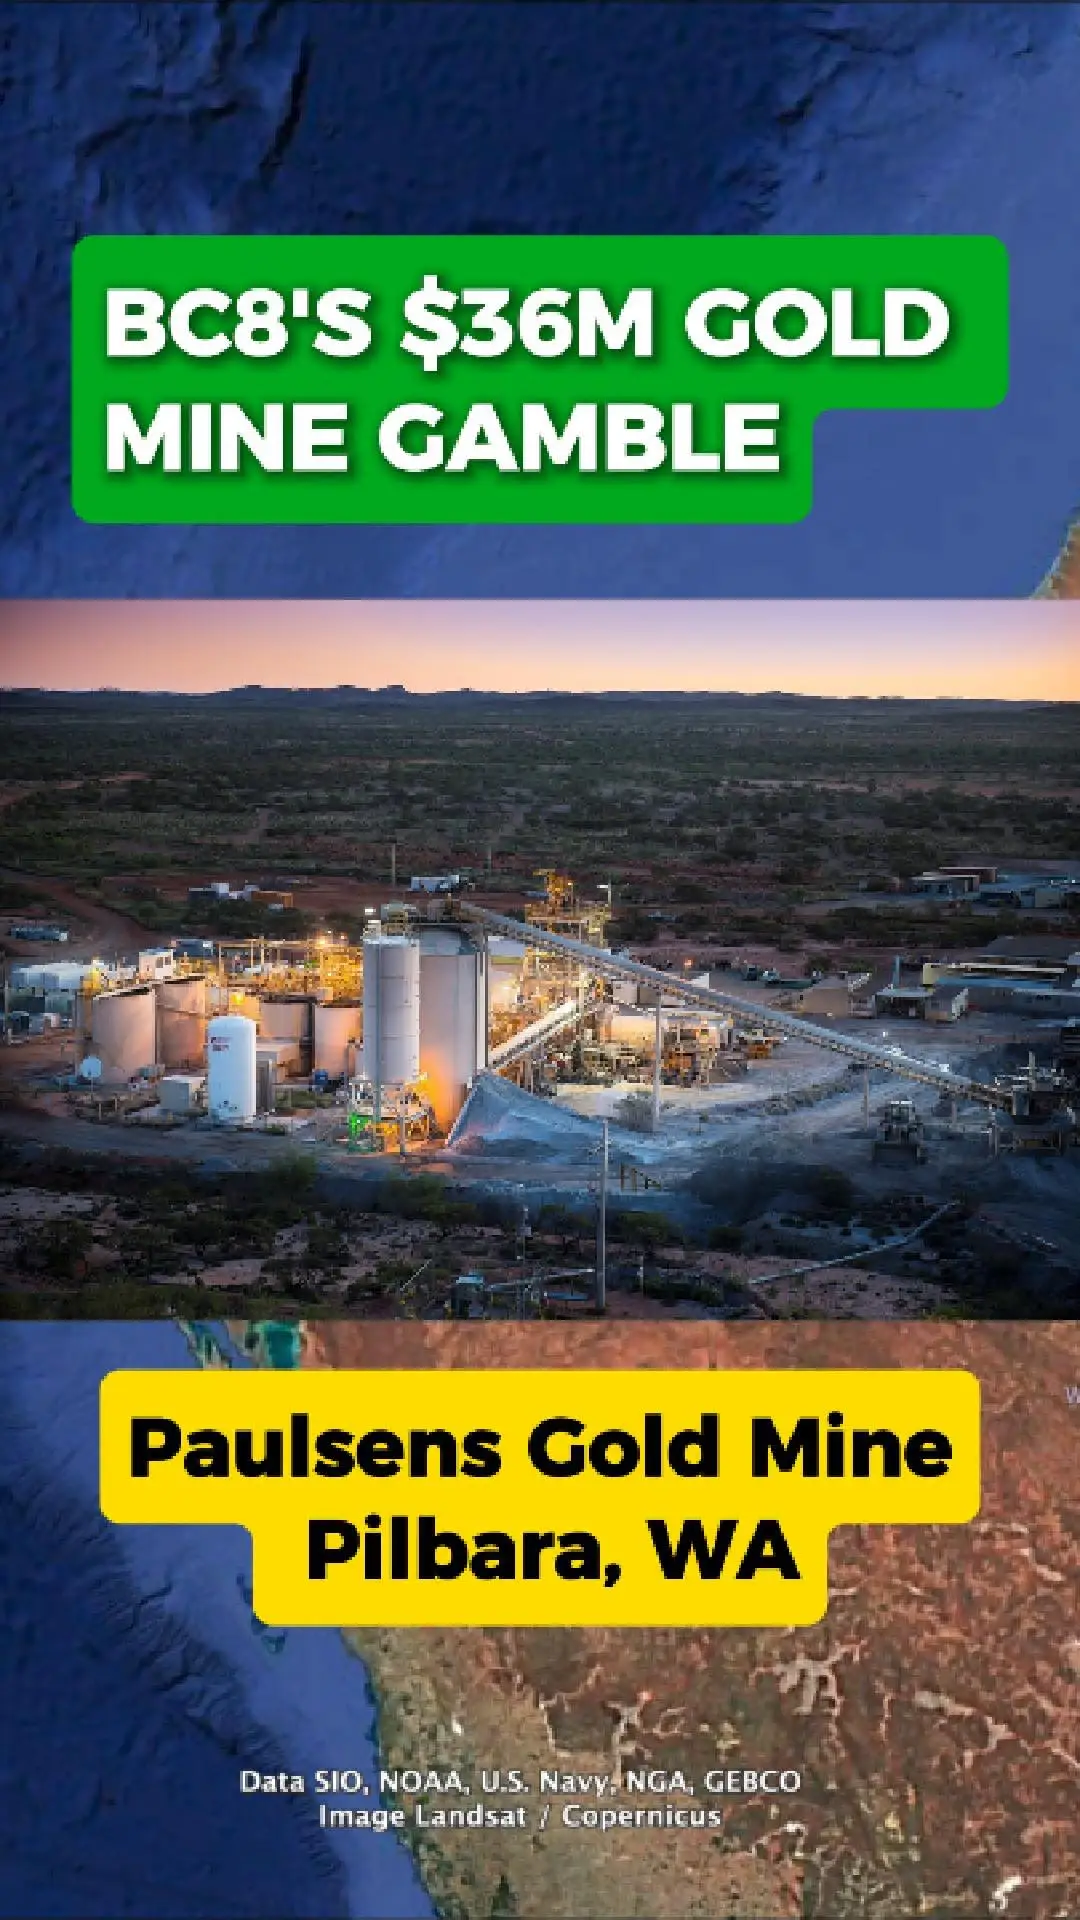
Black Cat hits 100,000oz run-rate in 12 months as Paulsens and Kal East deliver $BC8 a record quarter