ASX:BHP
— ASX Mining News & Discussion | BHP GROUP LIMITED
Copper power plays reshape the landscape for $BHP
(www.australianmining.com.au/copper-powe…)
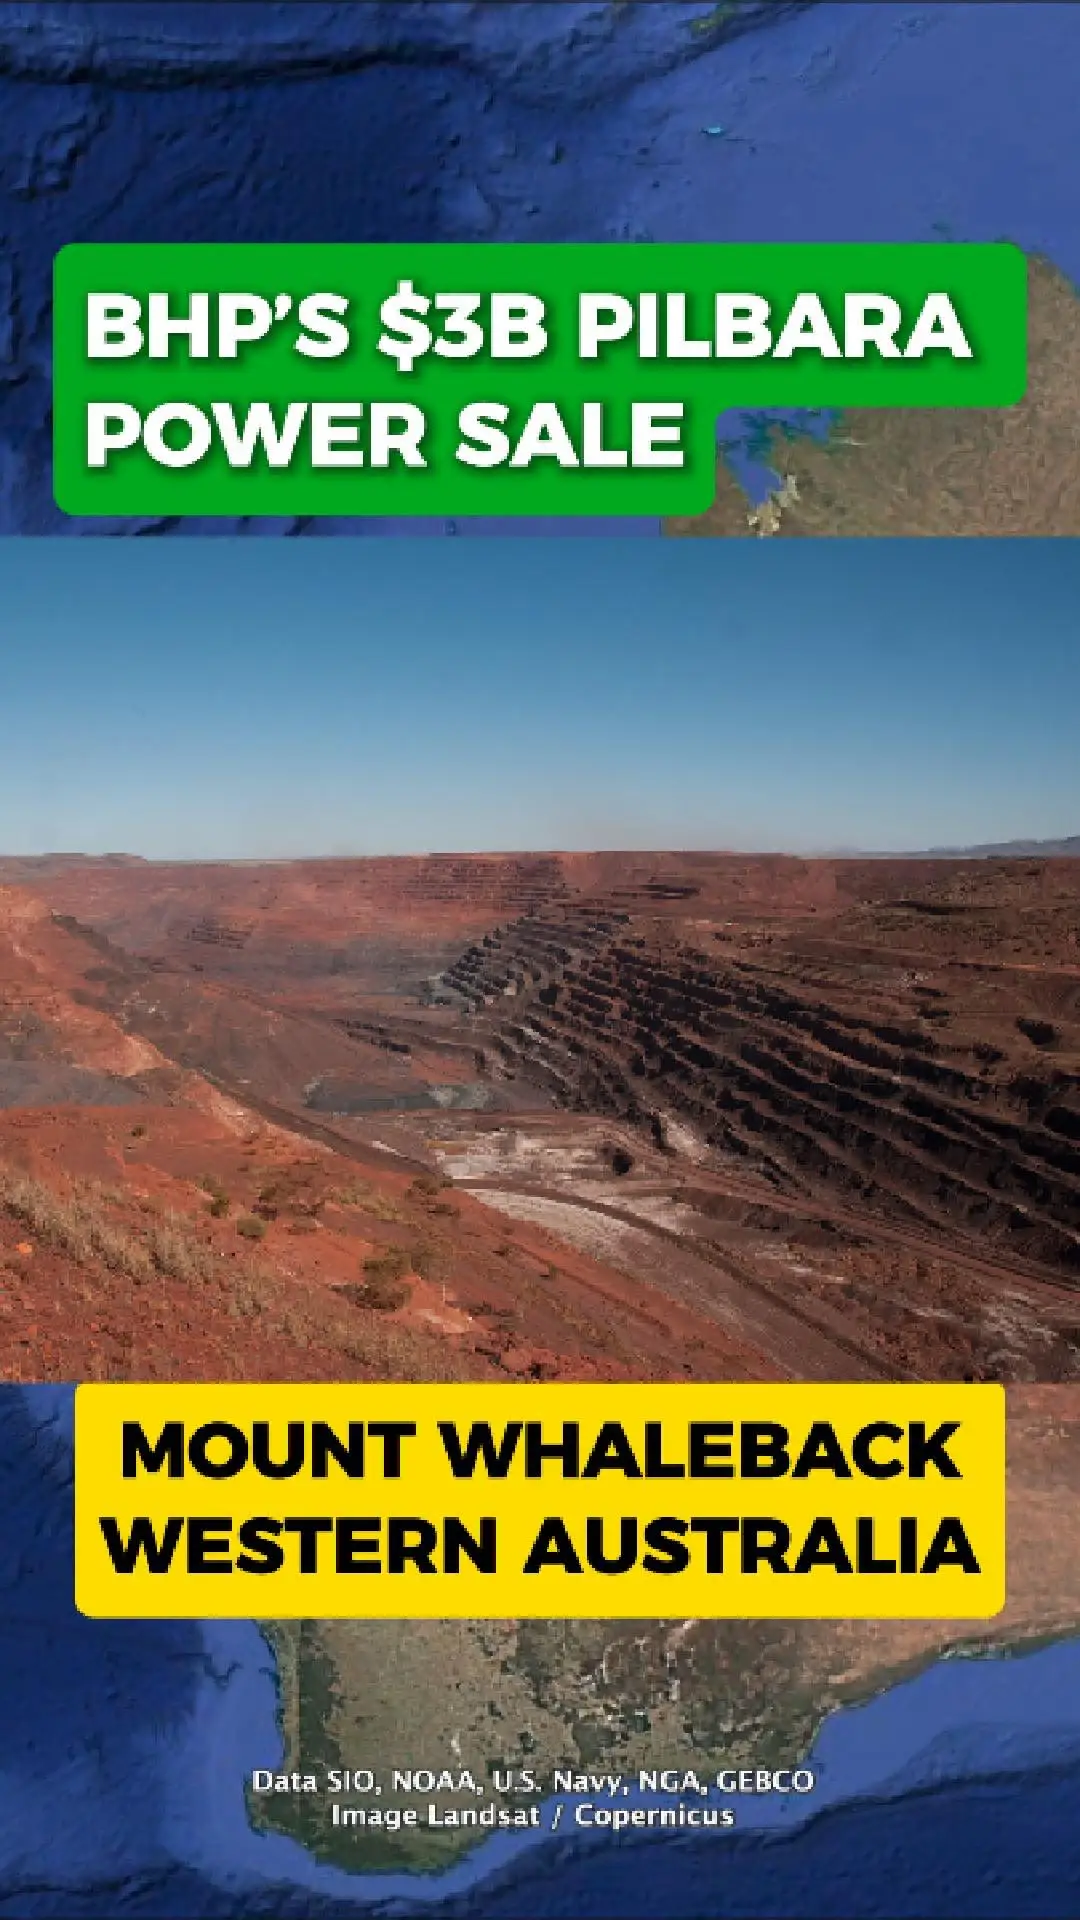
BHP Sells $3B Stake in Pilbara Power Network
Mount Whaleback — One Of The World’S Largest Open-Cut Iron-Ore Mines — Depends On A Vast Inland Power Network That Keeps Crushers, Haul Roads And Rem…
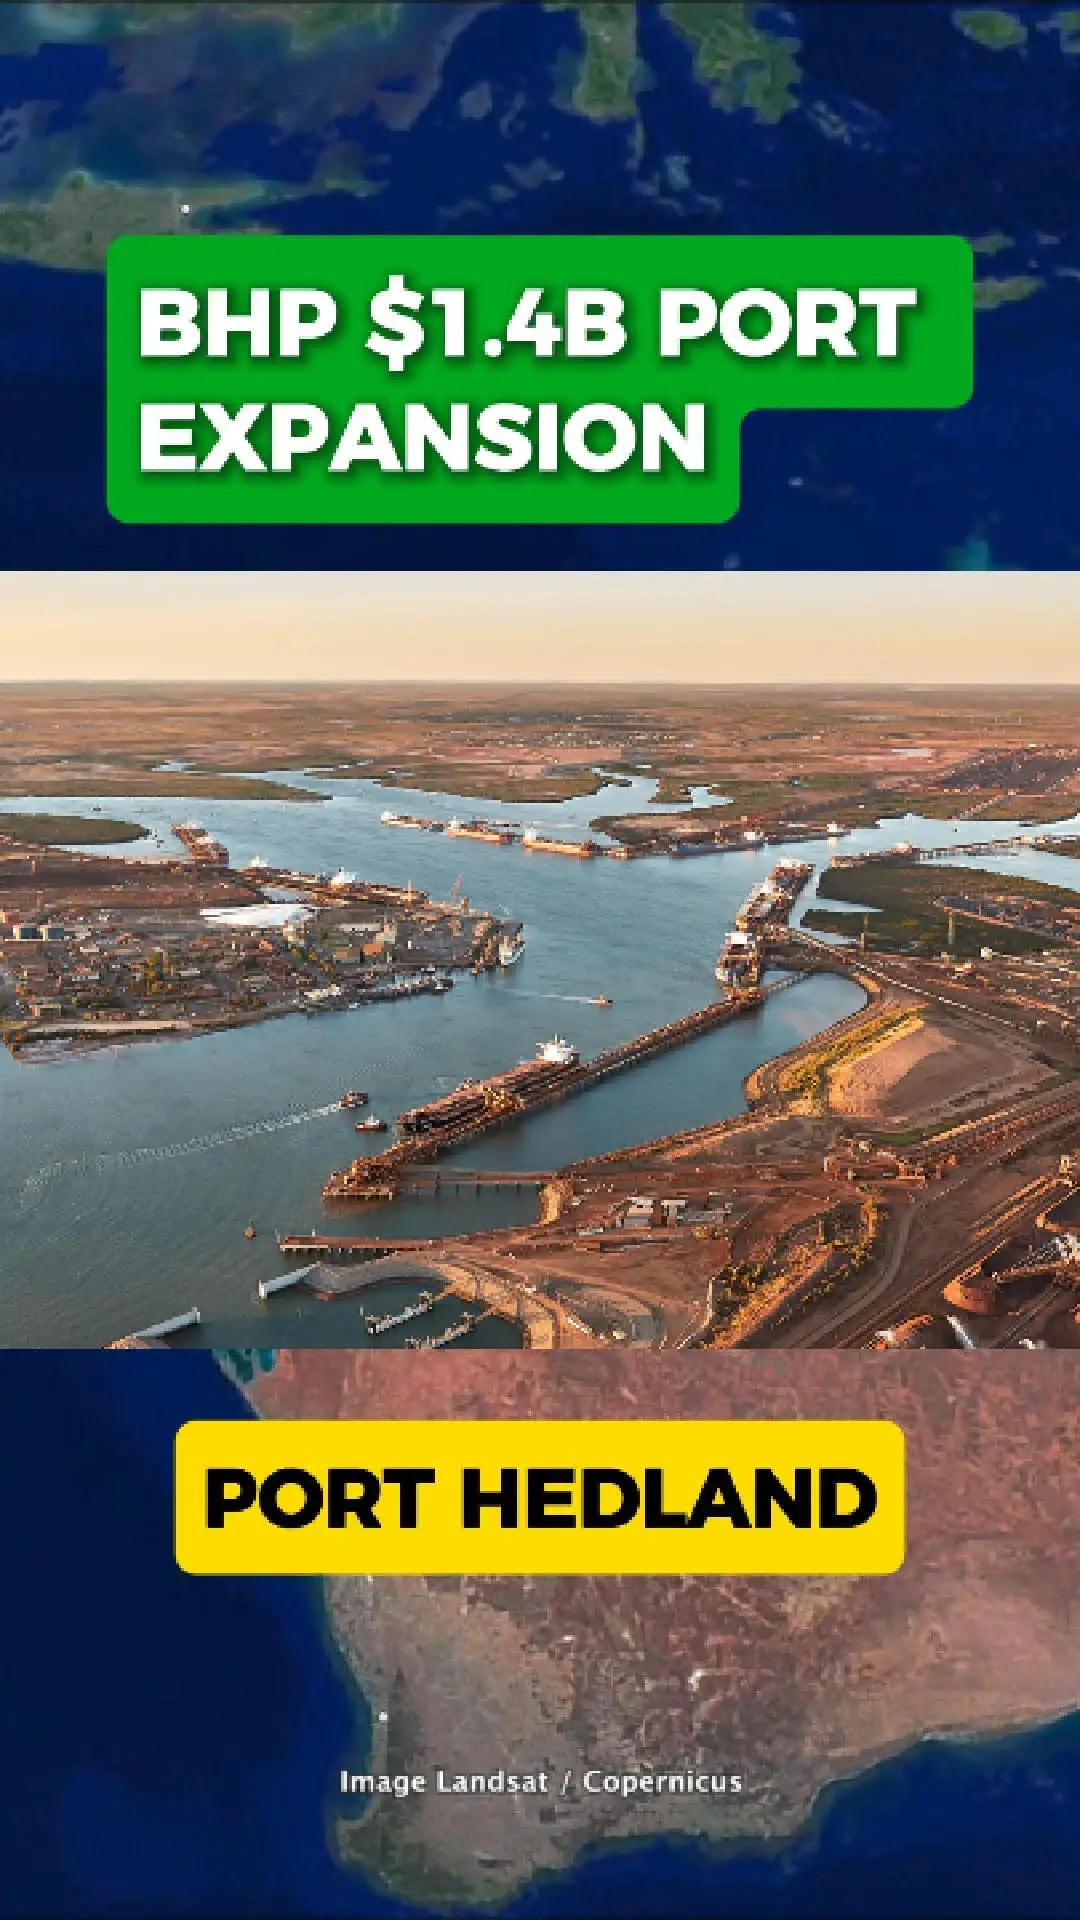
BHP’s $1.4 Billion Push to Lift Port Hedland Capacity
Bhp Is Investing $1.4 Billion To Upgrade Infrastructure At Port Hedland, The World’S Largest Bulk Export Port And The Backbone Of Australia’S Iron-Or…
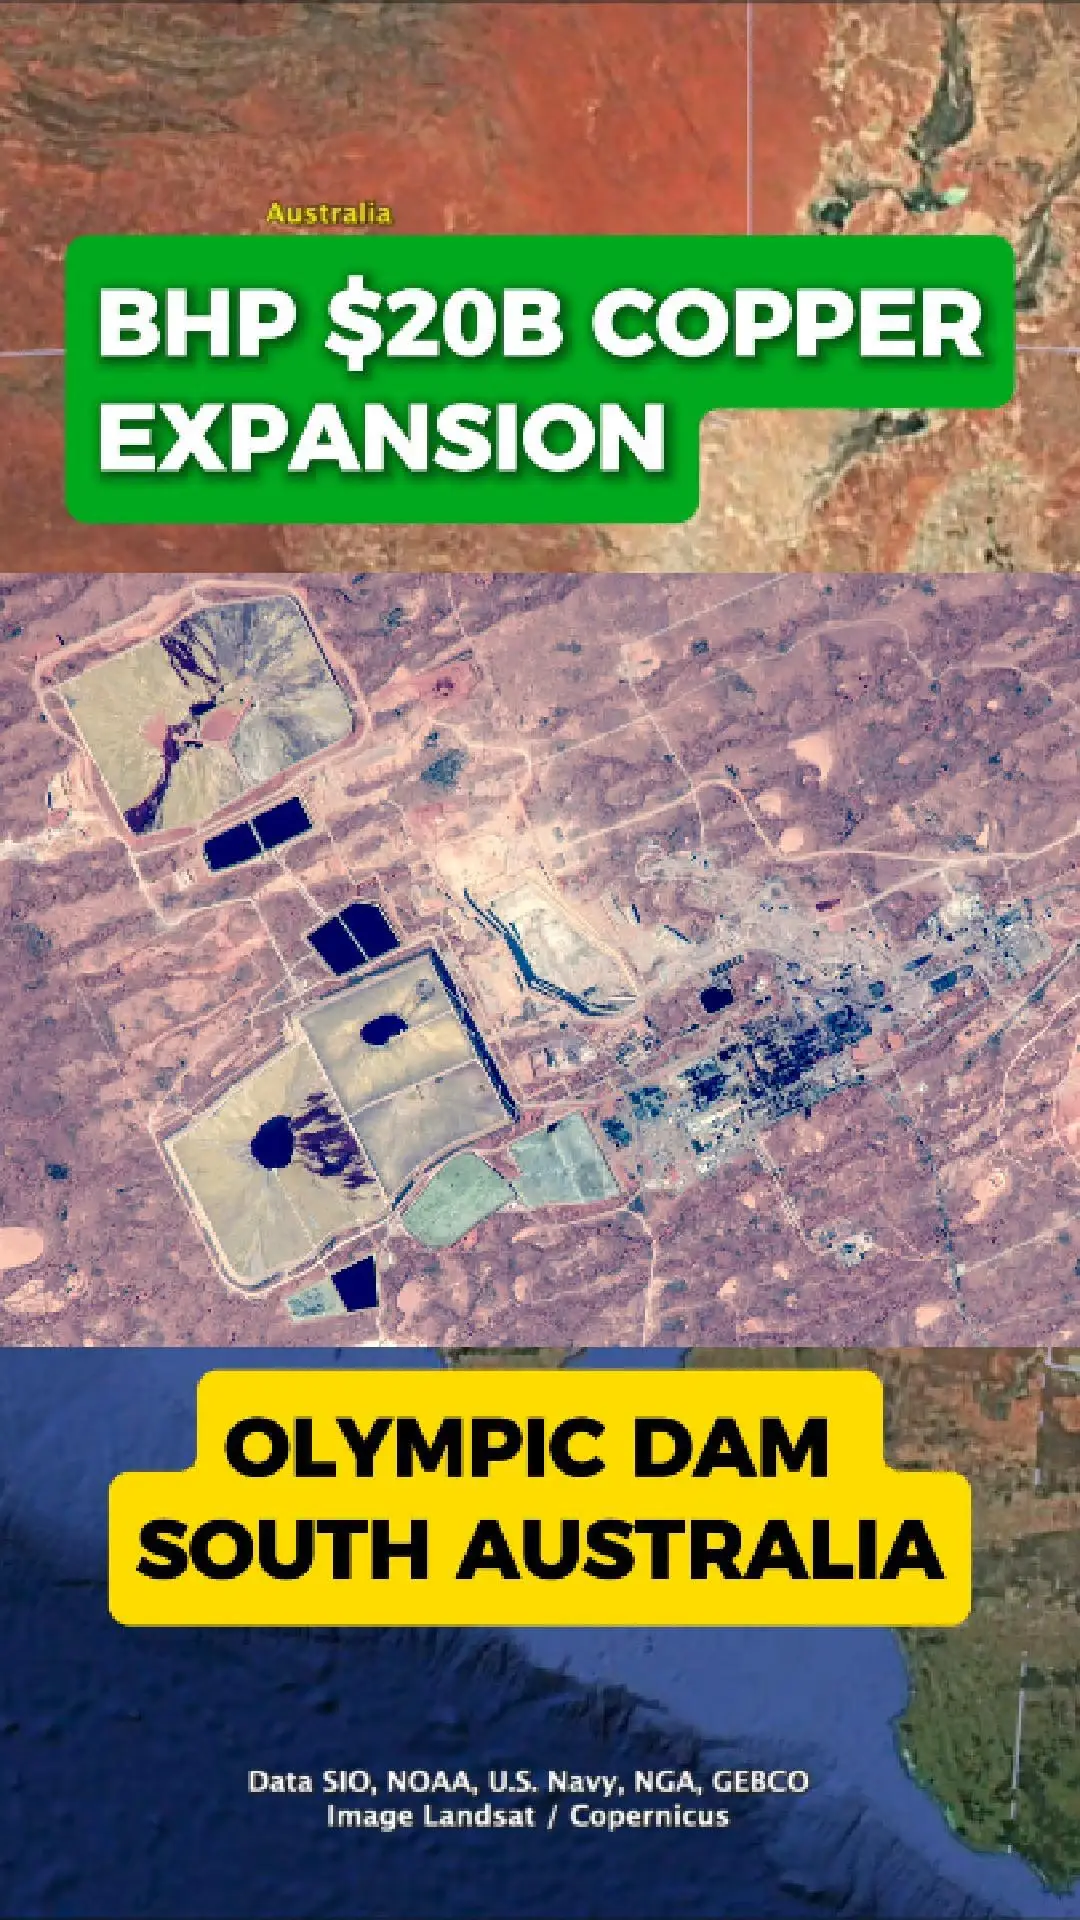
BHP Weighs $20 Billion Copper Expansion in South Australia
Around 500 Kilometres North Of Adelaide Sits Olympic Dam, One Of The World’S Largest And Most Valuable Copper Deposits. It’S A Long-Running Operation…
Who is Mike Henry? Chief Executive Officer of BHP
Mike Henry, The Chief Executive Officer Of Bhp Group Limited, An Australian Multinational Mining And Metals Giant, Has Emerged As A Dynamic Leader In…
BHP Achieves Strong Operational Results for FY23, Focuses on Safety and Growth
Bhp, One Of The World's Largest Mining Companies, Has Released Its Operational Review For The Year Ended 30 June 2023, Showcasing A Year Of Achieveme…
BHP Group Achieves Record Iron Ore Production in H1 2022
Bhp Group, The World's Largest Mining Company By Market Capitalisation, Has Announced A Record Half-Year Iron Ore Production Of 128 Million Tonnes In…
Loading more...