
B Boss Energy Ltd
ASX:BOE
Australia
616
How Does The Alta Mesa Acquisition Fit Into Boss Energy's Growth Strategy?
 ASX:BOE
Boss Energy Begins Drilling Program To Enhance Resources At Honeymoon Uranium Project In South Australia
ASX:BOE
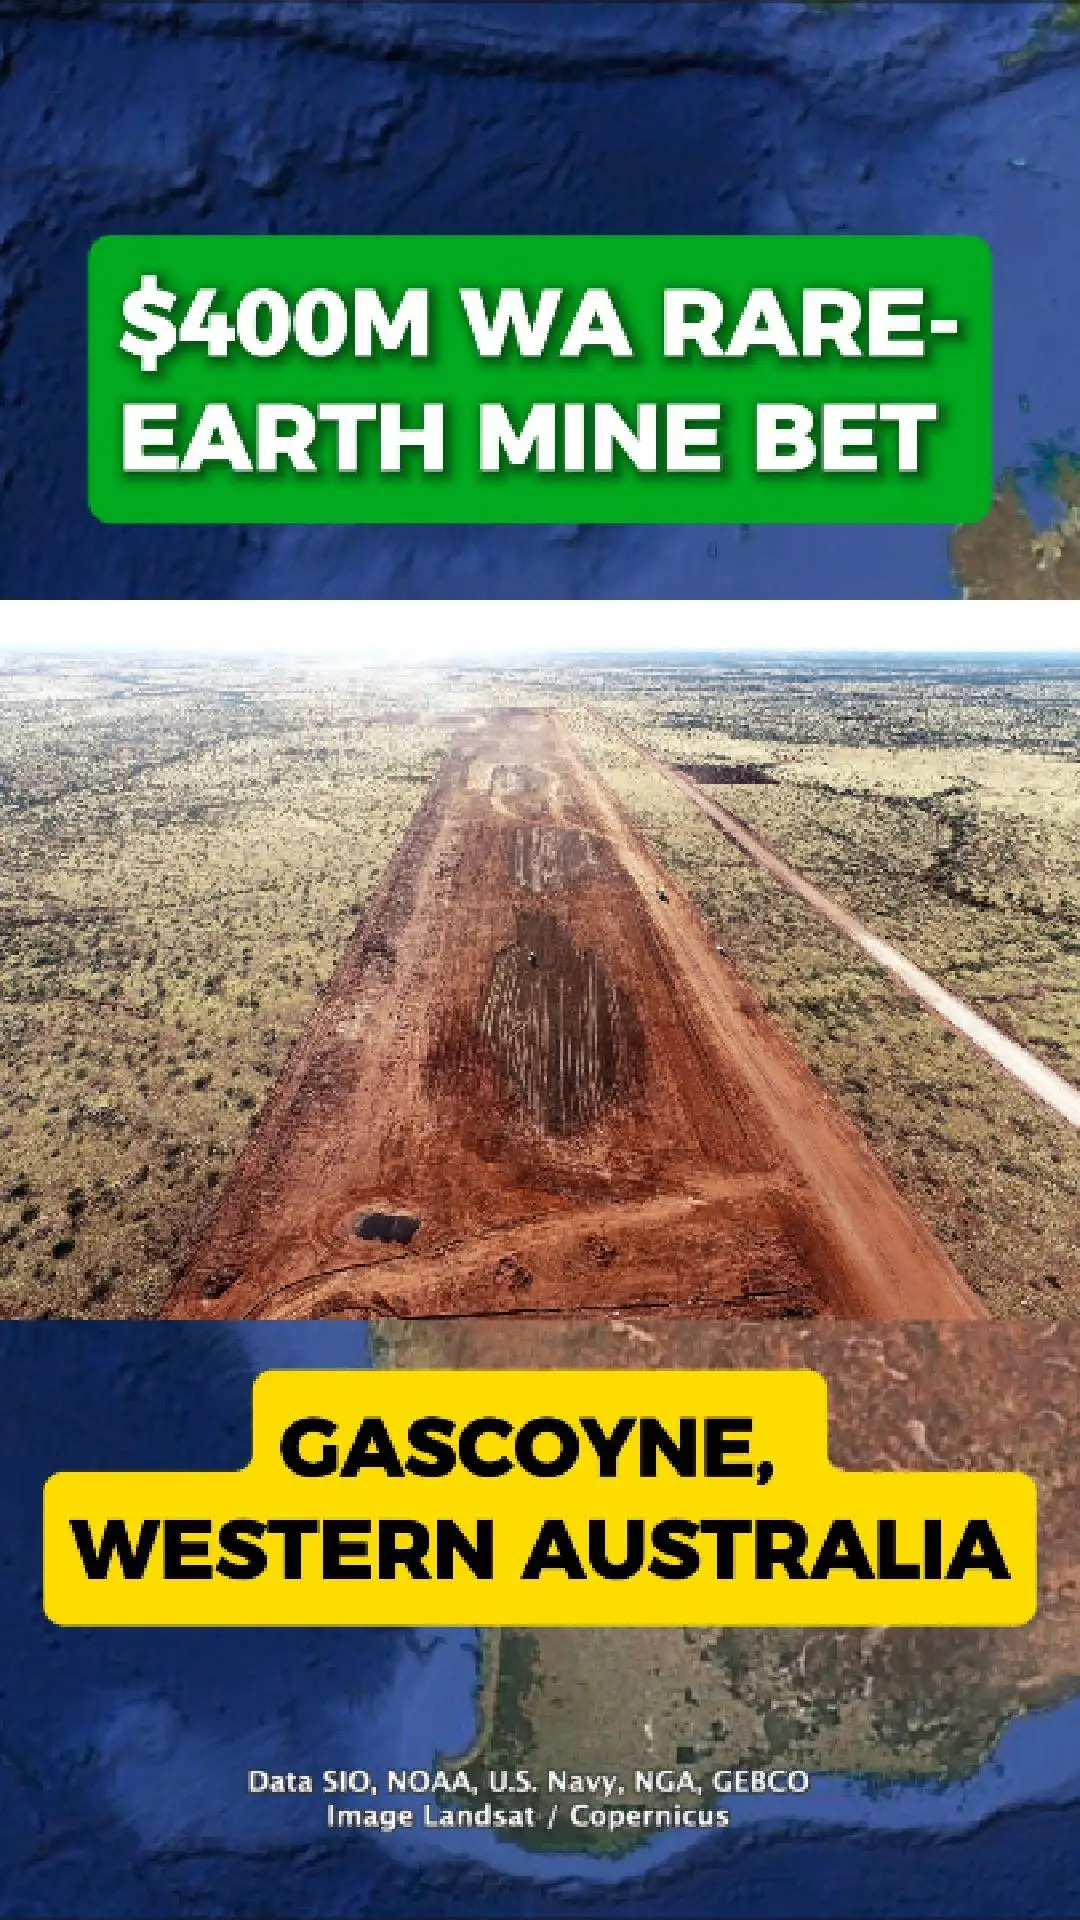
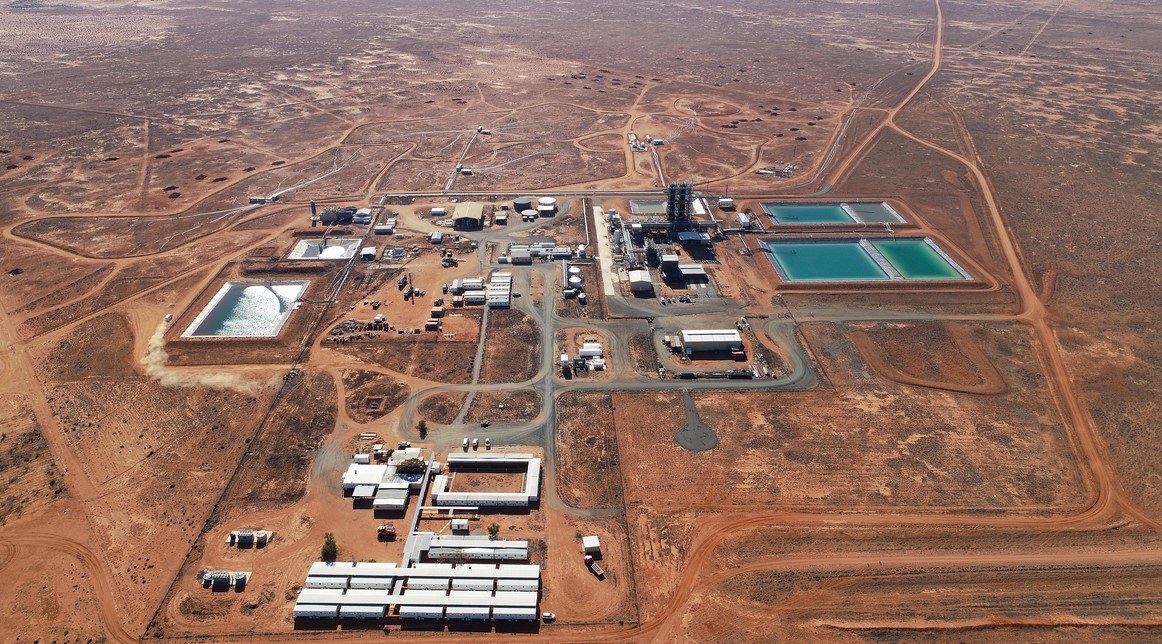
Why Spend Over $400m Building This Wa Rare-Earth Mine?
Around 1,000 Kilometres North Of Perth, The Yangibana Rare-Earths Project Is Aiming To Become One Of Australia’S Key Suppliers Of Neodymium And Praseodymium (Ndpr) — Metals Used In Electric-Vehicle Motors, Wind Turbines And Defence Technology. The Site Sits In The Gascoyne Region, Far From Major Towns But Close To Some Of The Country’S Best Rare-Earth Geology.
Backed By Hastings And Wyloo
The Project Is Being Advanced By Hastings Technology Metals, With Major Backing From Andrew Forrest’S Wyloo. Together They Are Working On A $470 Million Development Plan To Build The Mine And Processing Facilities Needed To Produce High-Grade Concentrate.
A Us Supply Chain In The Making
Yangibana Is Designed To Export Around 37,000 Tonnes Of Rare-Earth Concentrate Per Year. A Key Part Of The Strategy Is Feeding New Downstream Processing Capacity In The United States, As Global Manufacturers Look To Secure Non-Chinese Sources Of Critical Minerals For Clean-Energy Technologies.
Funding Remains The Final Hurdle
While Early Works Have Already Begun And Government Agencies Have Provided Loan Support, The Project Still Needs To Secure Its Remaining Capital Before Full Construction Can Move Ahead. That Leaves A Central Question For Investors And Policymakers Alike: Is Yangibana Finally Close To Becoming A Reality?
ASX:HAS
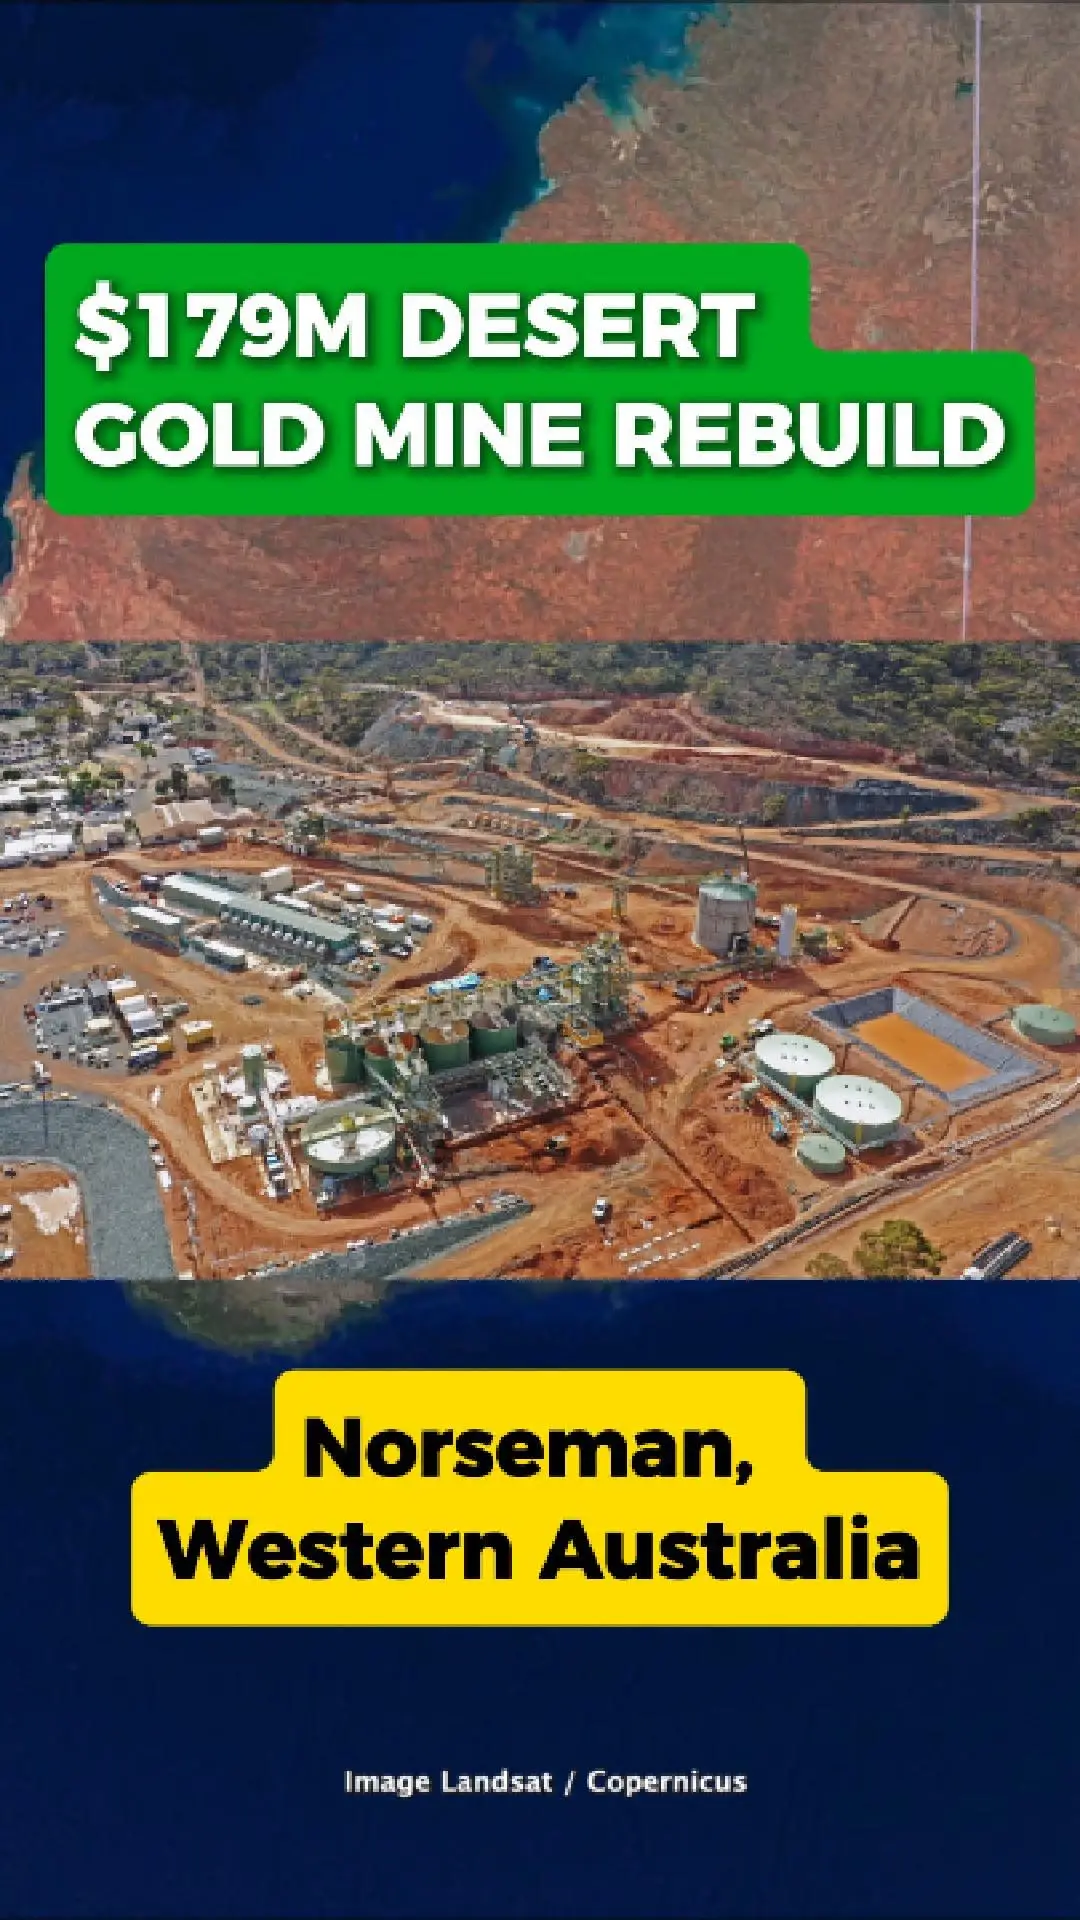
$179m Desert Gold Mine Rebuild At Norseman
Pantoro Is Pushing Ahead With One Of Western Australia’S Biggest Gold Revivals, Investing $179 Million To Restart The Historic Norseman Gold Project In The State’S Remote Desert.
A Major Rebuild In The Wa Outback
The Company Has Overhauled The Entire Operation, Installing A New 1.2-Million-Tonne-Per-Year Processing Plant, Reopening Underground Mines And Bringing Open Pits Back Into Production.
These Upgrades Mark The Most Significant Work At Norseman Since The Operation Was Placed On Care And Maintenance Nearly A Decade Ago.
Nearly One Million Ounces In Reserve
Pantoro Says The Project Now Holds Around 949,000 Ounces In Ore Reserves, With Strong Growth Potential.
Less Than One-Third Of The Known Mineralised Areas Have Been Drilled For Conversion So Far, Leaving A Large Portion Of The Field Still Untapped.
A Historic Goldfield Set For A Comeback
Norseman Has Produced More Than Six Million Ounces Since The 1930s, Making It One Of Australia’S Most Storied Gold Camps.
With New Infrastructure, Modern Equipment And Ongoing Drilling, Pantoro Is Aiming To Return The Site To Significant, Long-Term Production.
Could This Be Norseman’S Next Big Chapter?
With The Rebuild Now Largely Complete And New Ore Sources Coming Online, Pantoro Is Positioning Norseman For A Major Comeback In Western Australia’S Goldfields.
The Next Phase Of Exploration And Development Will Determine Just How Big The Revival Could Become.
ASX:PNR
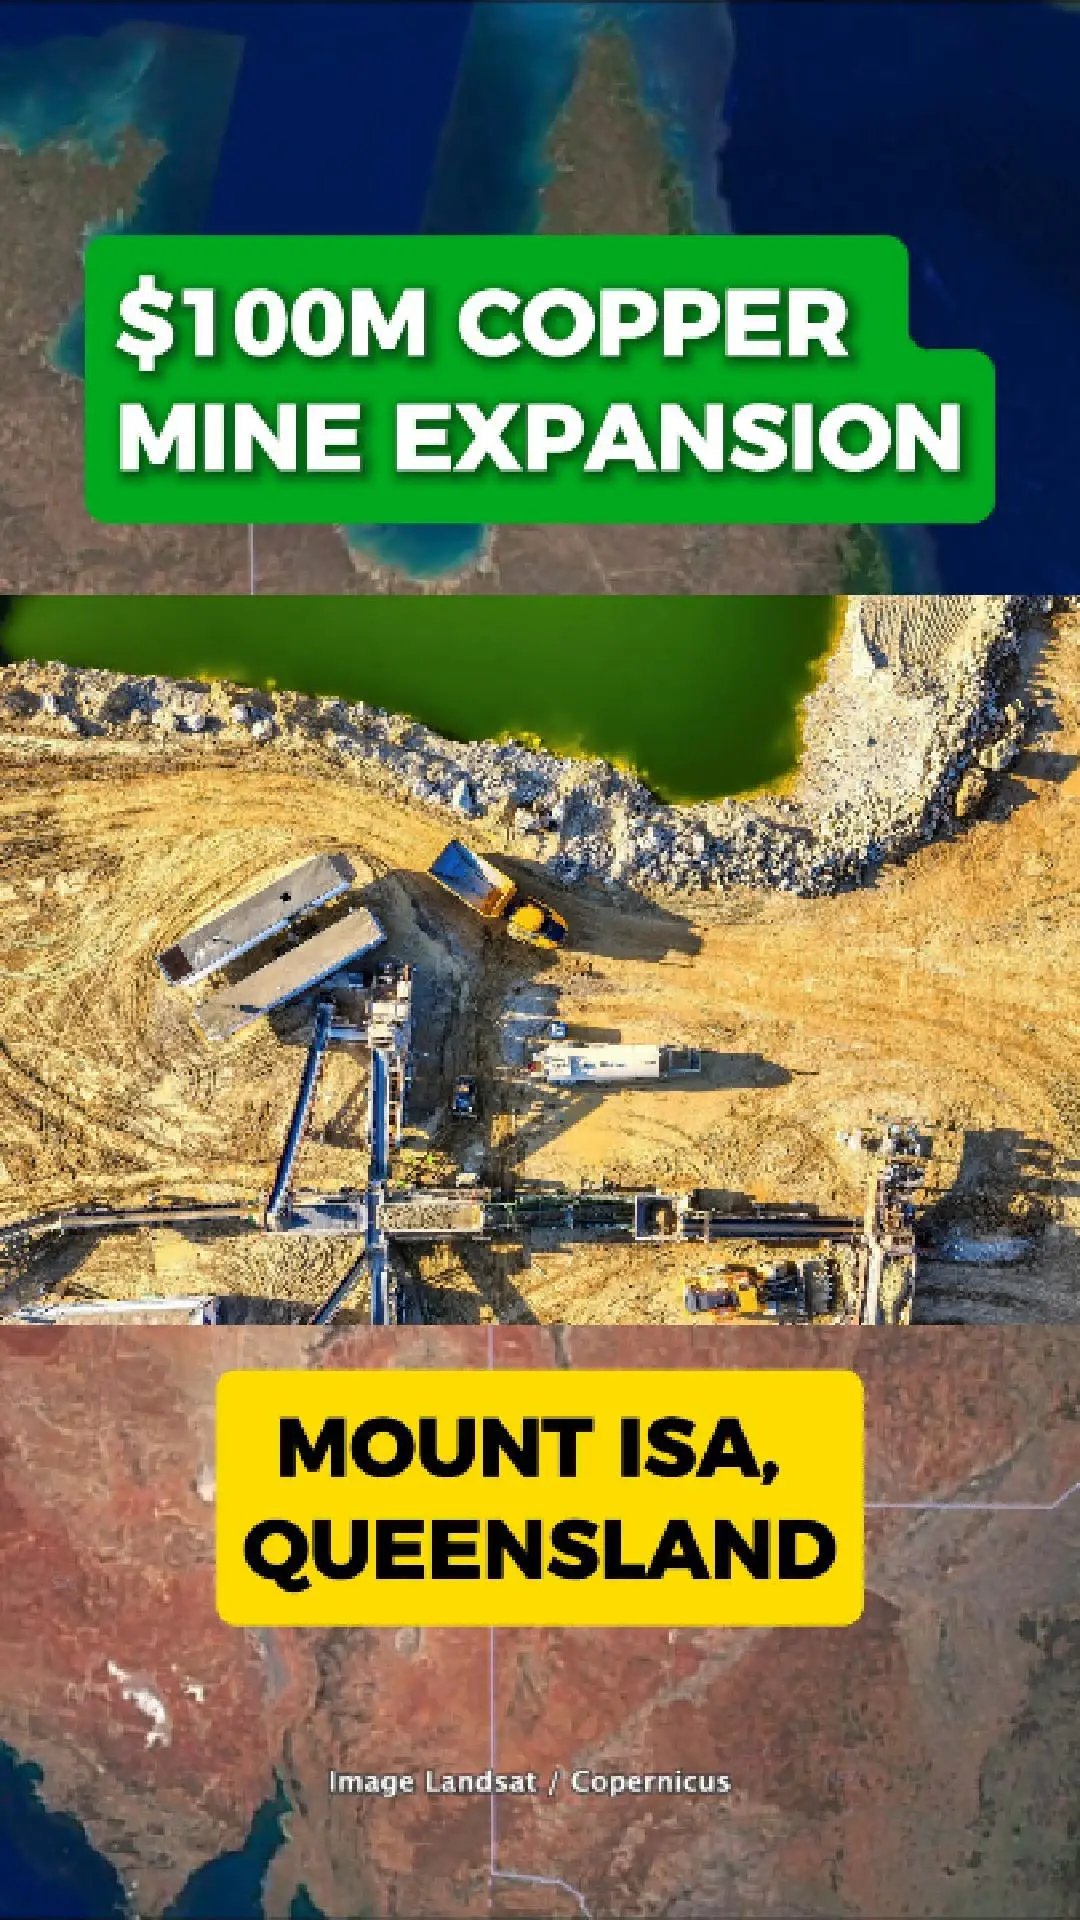
$100 Million Plan To Boost Copper Output In North Queensland
Major Upgrade At Eloise Mine
Aic Mines Is Investing Around $100 Million Into Expanding The Eloise Copper Mine, Located South-East Of Mount Isa In North Queensland. The Project Aims To Modernise The Older Underground Operation And Bring New Life To The Site.
Jericho Deposit Set To Drive Growth
A Key Part Of The Plan Is The Development Of The Nearby Jericho Deposit. Once Opened, Jericho Is Expected To Send About 600,000 Tonnes Of Ore Each Year Into Eloise’S Processing Plant.
Bigger Plant, Bigger Production
To Handle The Extra Ore, Aic Mines Is Expanding The Processing Plant To 1.1 Million Tonnes A Year. Together, The Eloise And Jericho Operations Could Produce Around 20,000 Tonnes Of Copper Annually, Creating A New Copper Hub In The Mount Isa Region.
A Potential Boost For Queensland’S Copper Belt
With Global Demand For Copper Growing, The Combined Project Could Become A Significant Contributor To The State’S Critical Minerals Industry.
Whether This $100 Million Move Sparks Queensland’S Next Copper Boom Remains To Be Seen, But It Marks A Major Step For Aic Mines And The Region’S Mining Future.
ASX:A1M
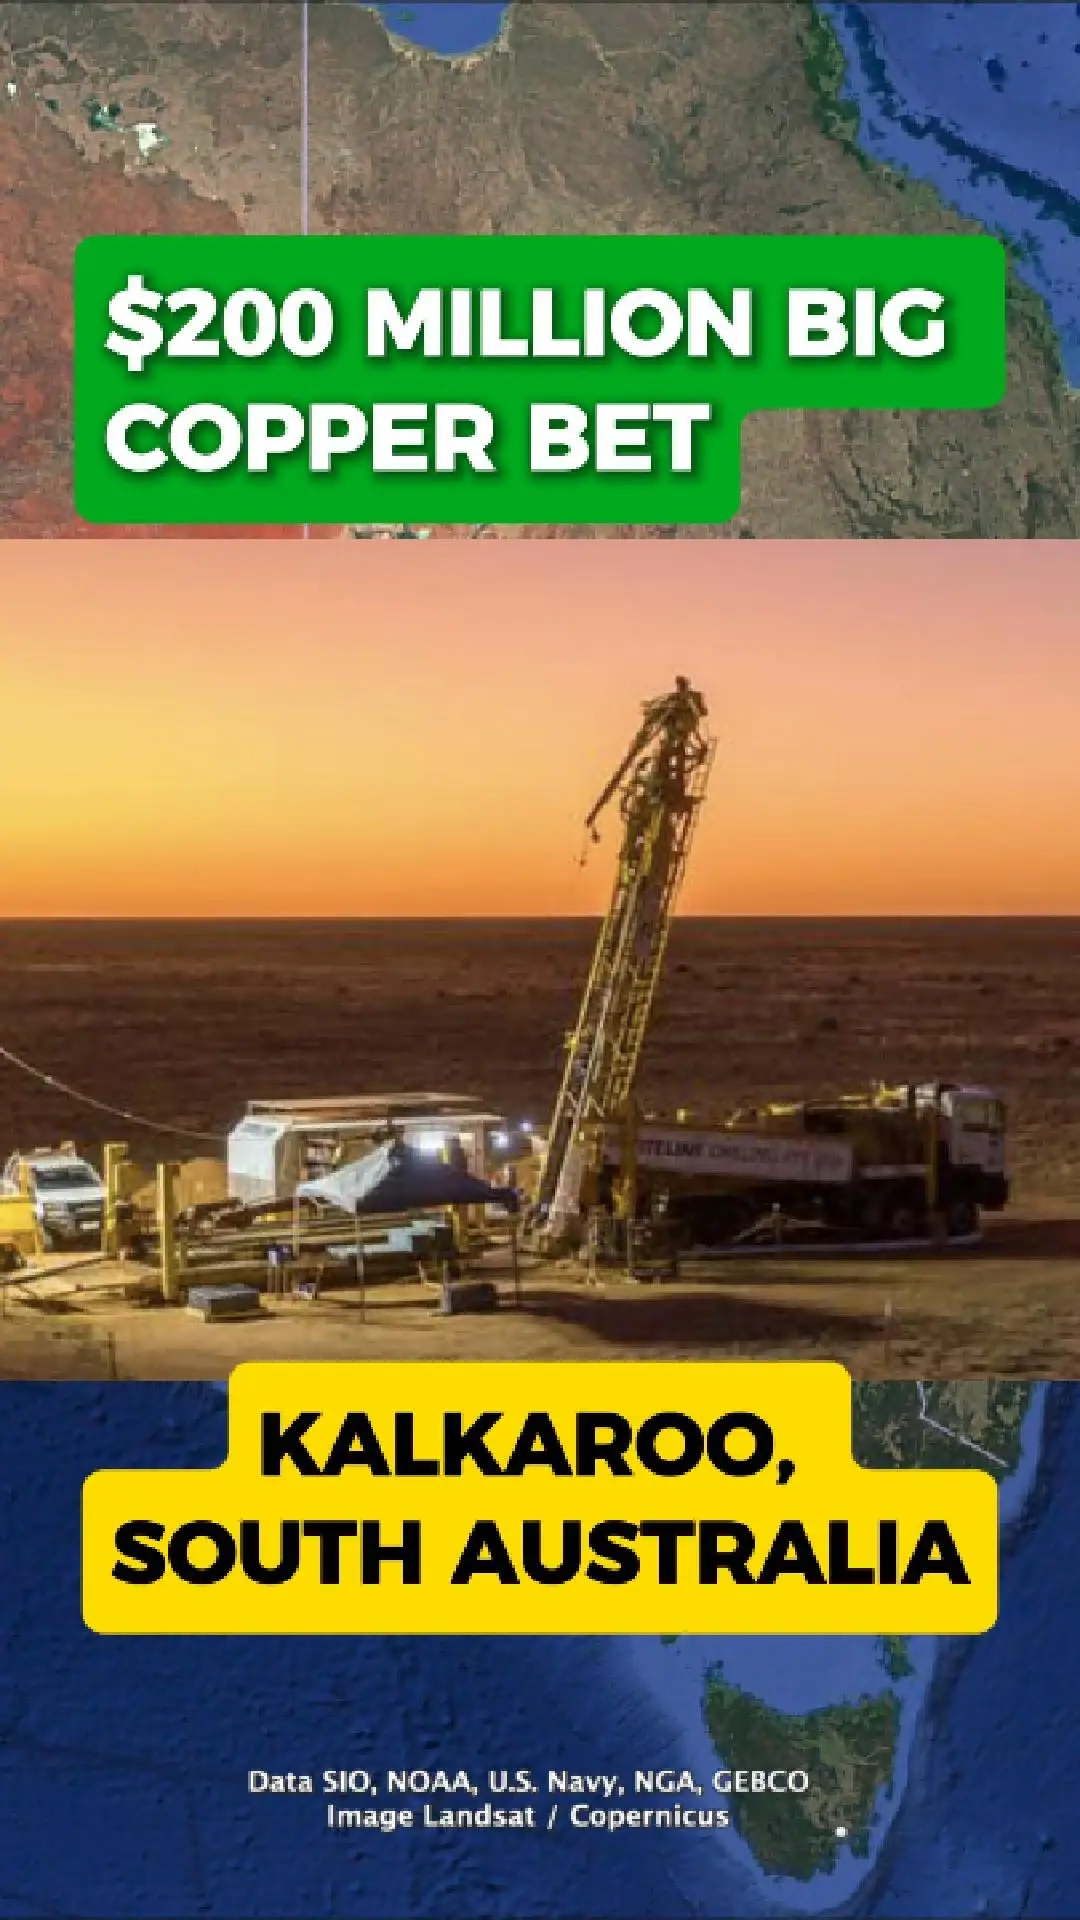
$210 Million Deal Revives Major Copper–Gold Project In South Australia
A Major Funding Agreement Is Breathing New Life Into One Of South Australia’S Most Significant Undeveloped Mineral Deposits. Kalkaroo, Located About 400 Kilometres North Of Adelaide, Holds One Of Australia’S Largest Copper–Gold Resources And Has Been In The Planning Stages For Years Without Moving Into Full Development.
Havilah’S Long-Standing Project Gains Momentum
Owned By Havilah Resources, The Kalkaroo Project Has Remained Idle As The Company Sought The Right Partner To Progress The Orebody Toward Production. Despite Its Size And Potential, The Project Has Not Advanced To Mine Construction, And The Remote Landscape Shows No Surface Infrastructure Or Open-Pit Activity.
Sandfire Commits Up To $210 Million
A New Agreement With Sandfire Resources Is Now Set To Accelerate The Next Phase. Sandfire Has Committed Up To $210 Million Under An Earn-In Structure, Including Funding For Fresh Drilling Aimed At Upgrading And Expanding The Resource Base. The Plan Includes A New Pre-Feasibility Study And Thousands Of Metres Of Drilling To Better Define The Deposit.
Could Kalkaroo Finally Become A Mine?
The Substantial Investment Marks The Most Serious Step Toward Development The Project Has Seen In Years. If The Drilling Program Confirms Its Potential And The Study Demonstrates Economic Viability, Kalkaroo Could Progress Toward Becoming One Of The Next Major Copper–Gold Mines In The Region.
Industry Observers Say The Deal Signals Growing Confidence In South Australia’S Copper Future, Especially As Demand For Copper Continues To Rise Globally.
ASX:HAV
Popular Stocks 🚀
Show more