
C Carnaby Resources Limited
ASX:CNB
Australia
911
Who Is Rob Watkins? Ceo Of Carnaby Resources
 ASX:CNB
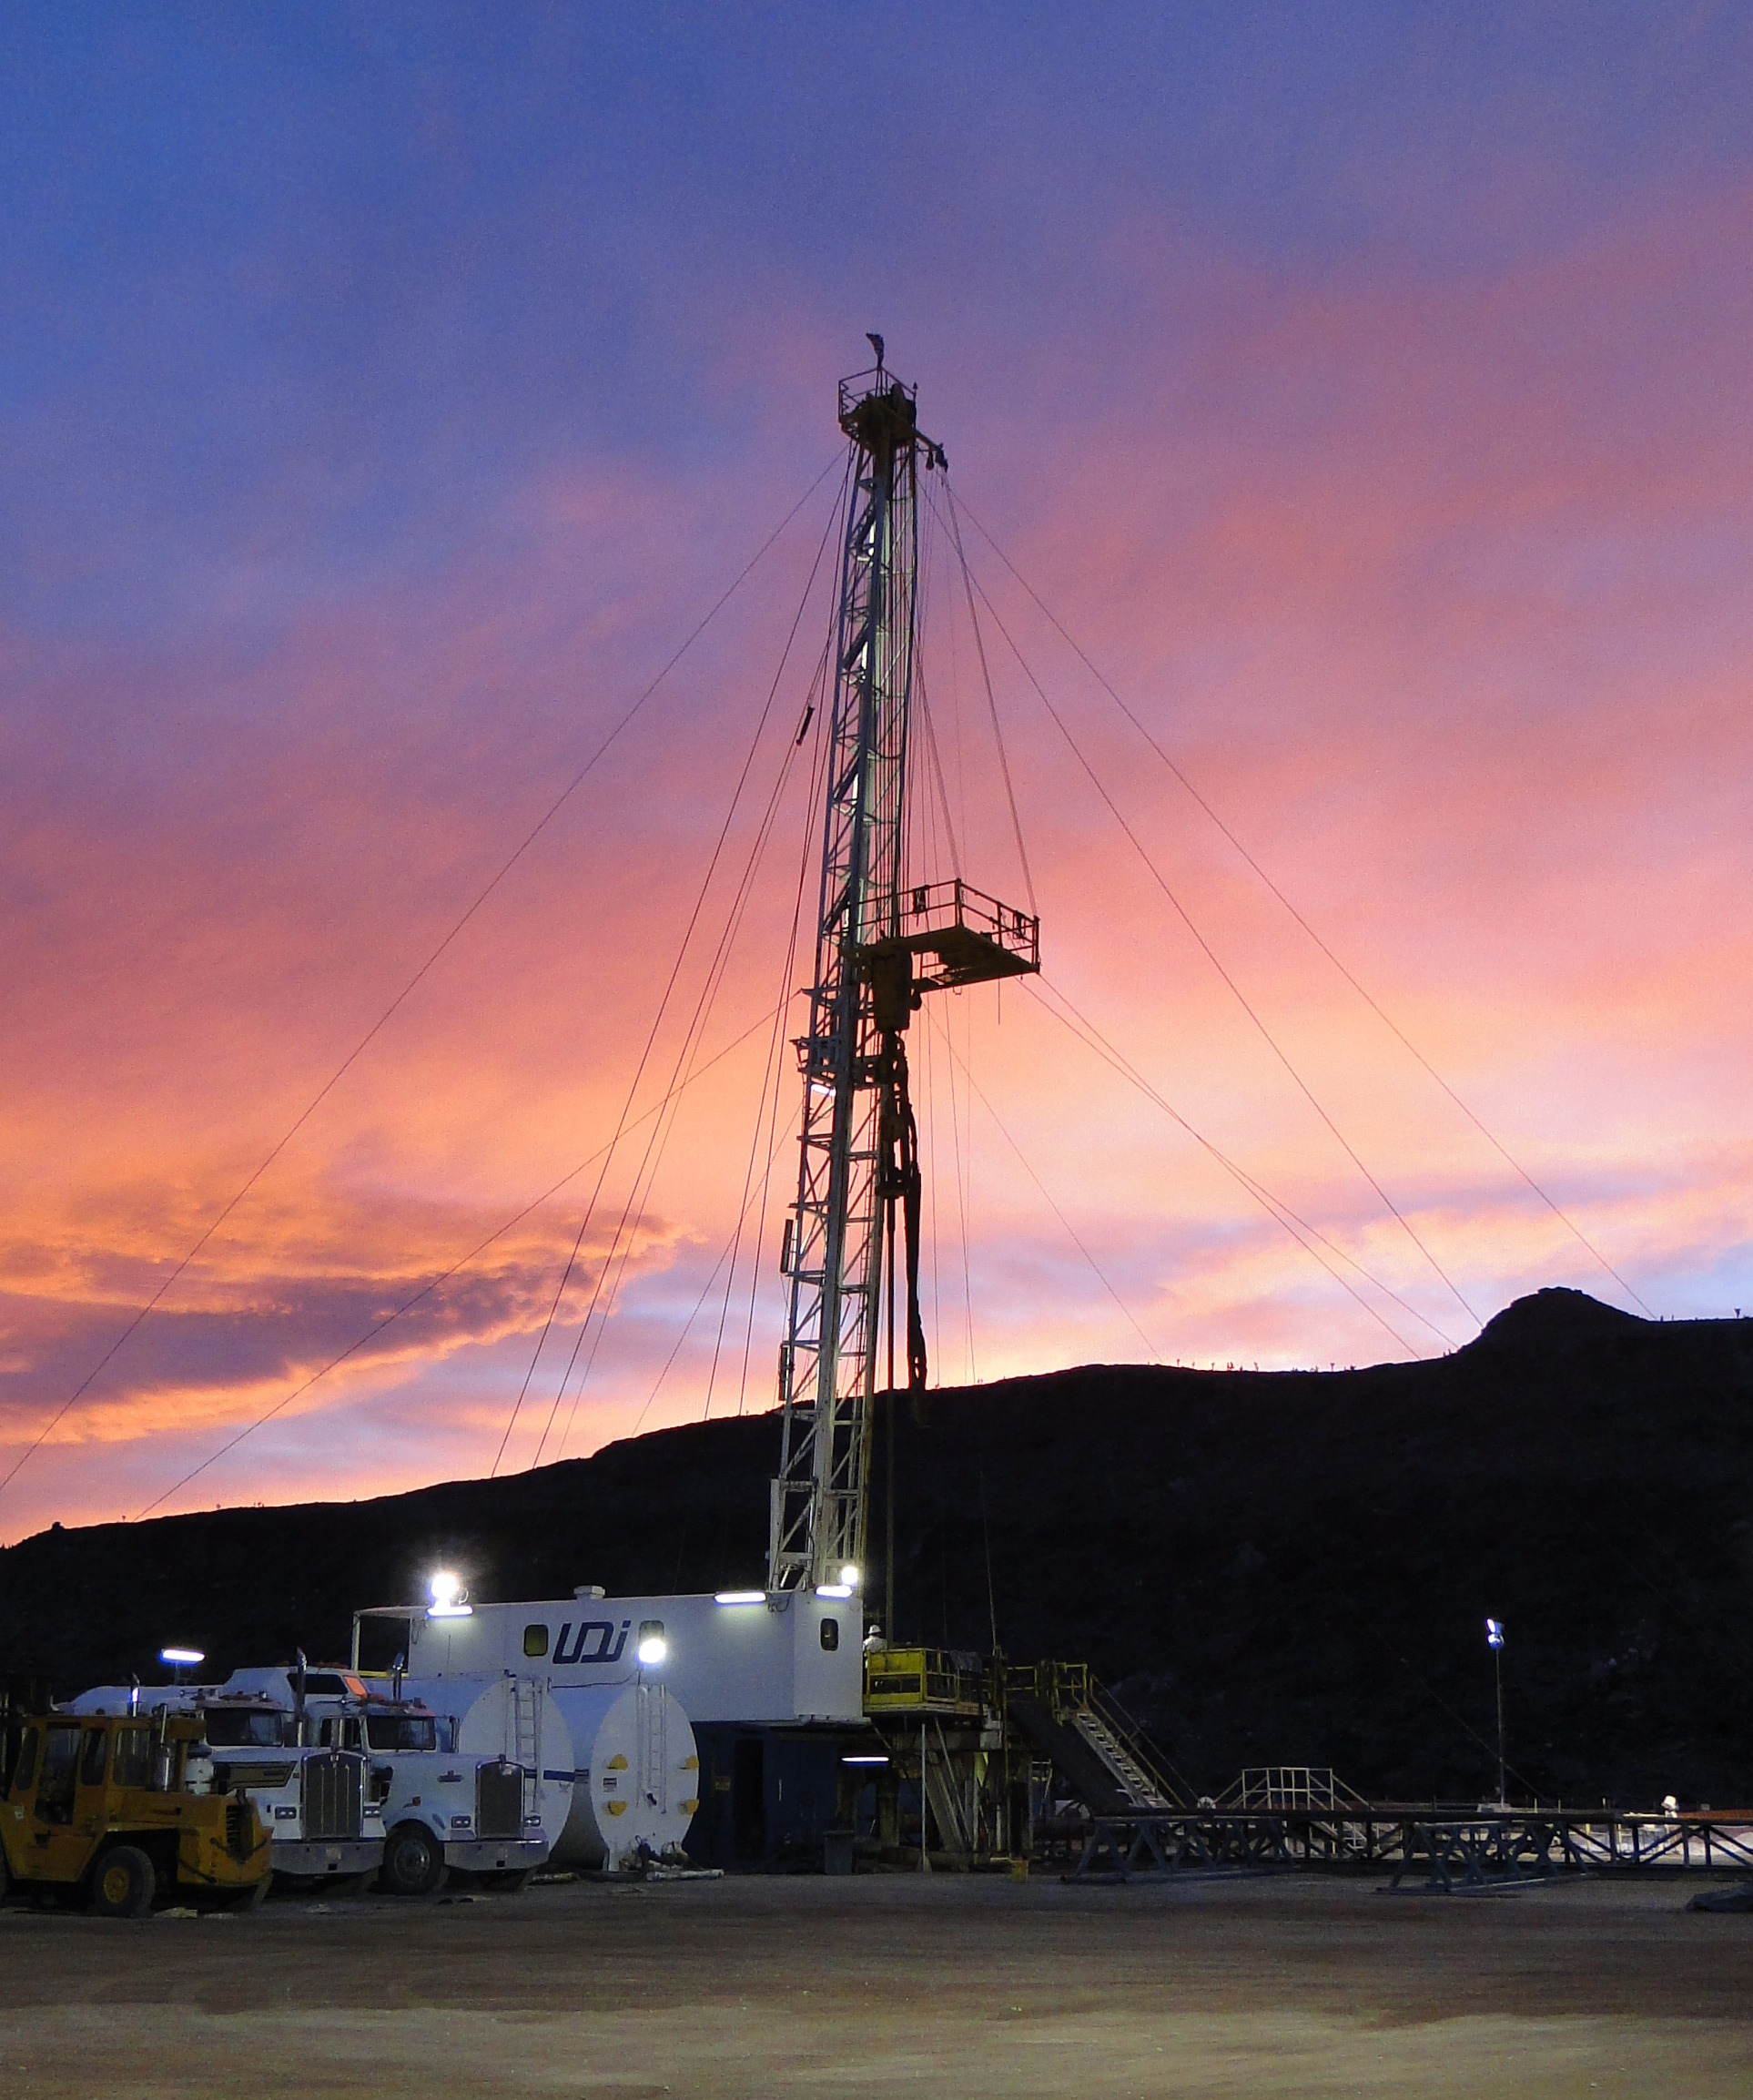
What Are Carnaby Resources Key Discoveries At The Greater Duchess Copper Gold Project?
ASX:CNB
Carnaby Resources Strikes Gold: Is Mount Hope The Future Of Mining?
ASX:CNB

Can Carnaby's Scoping Study Chart A New Course For Greater Duchess?
ASX:CNB
Unveiling The Hidden Riches In Queensland - Carnaby Resources Unearths Highly Significant Gold And Copper Deposits
ASX:CNB

Why Carnaby Resources Is Excited About The Greater Duchess Project?
ASX:CNB

Popular Stocks 🚀
Show more