C Centrex Limited
ASX:CXM
Australia
Revenue: 30.7m
$0.0/sec
CENTREX LIMITED Chat
Stonksurfer42
2y

#ASX:CXM
Why Has Centrex Limited Reduced the Budget for the Ardmore Phosphate Project Stage 1.5 Expansion?
Tendies_Inbound
2y

#ASX:CXM
Why Did Centrex Successfully Complete a $4.25M Placement and Launch Share Purchase Plan?
Tendies_Inbound
2y
#ASX:CXM
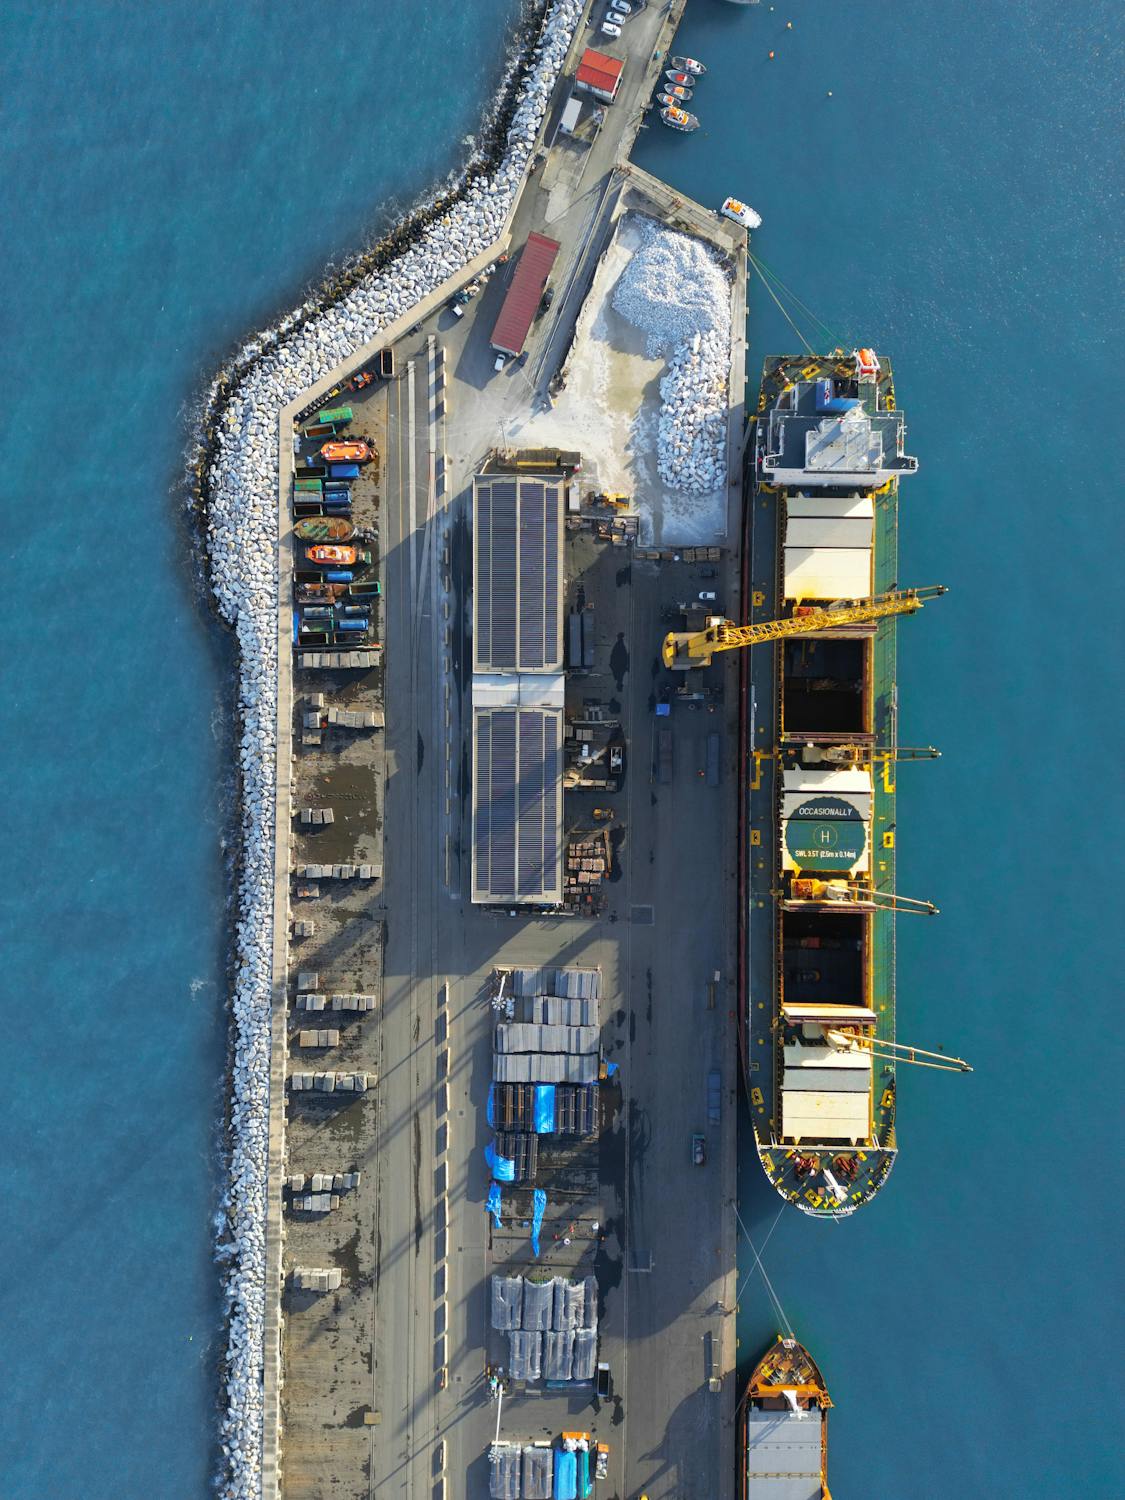
Centrex Limited Expands Operations and Makes Australian History with Phosphate Rock Exports