F Flight Centre Travel Group Li…
ASX:FLT
Australia
1.5k
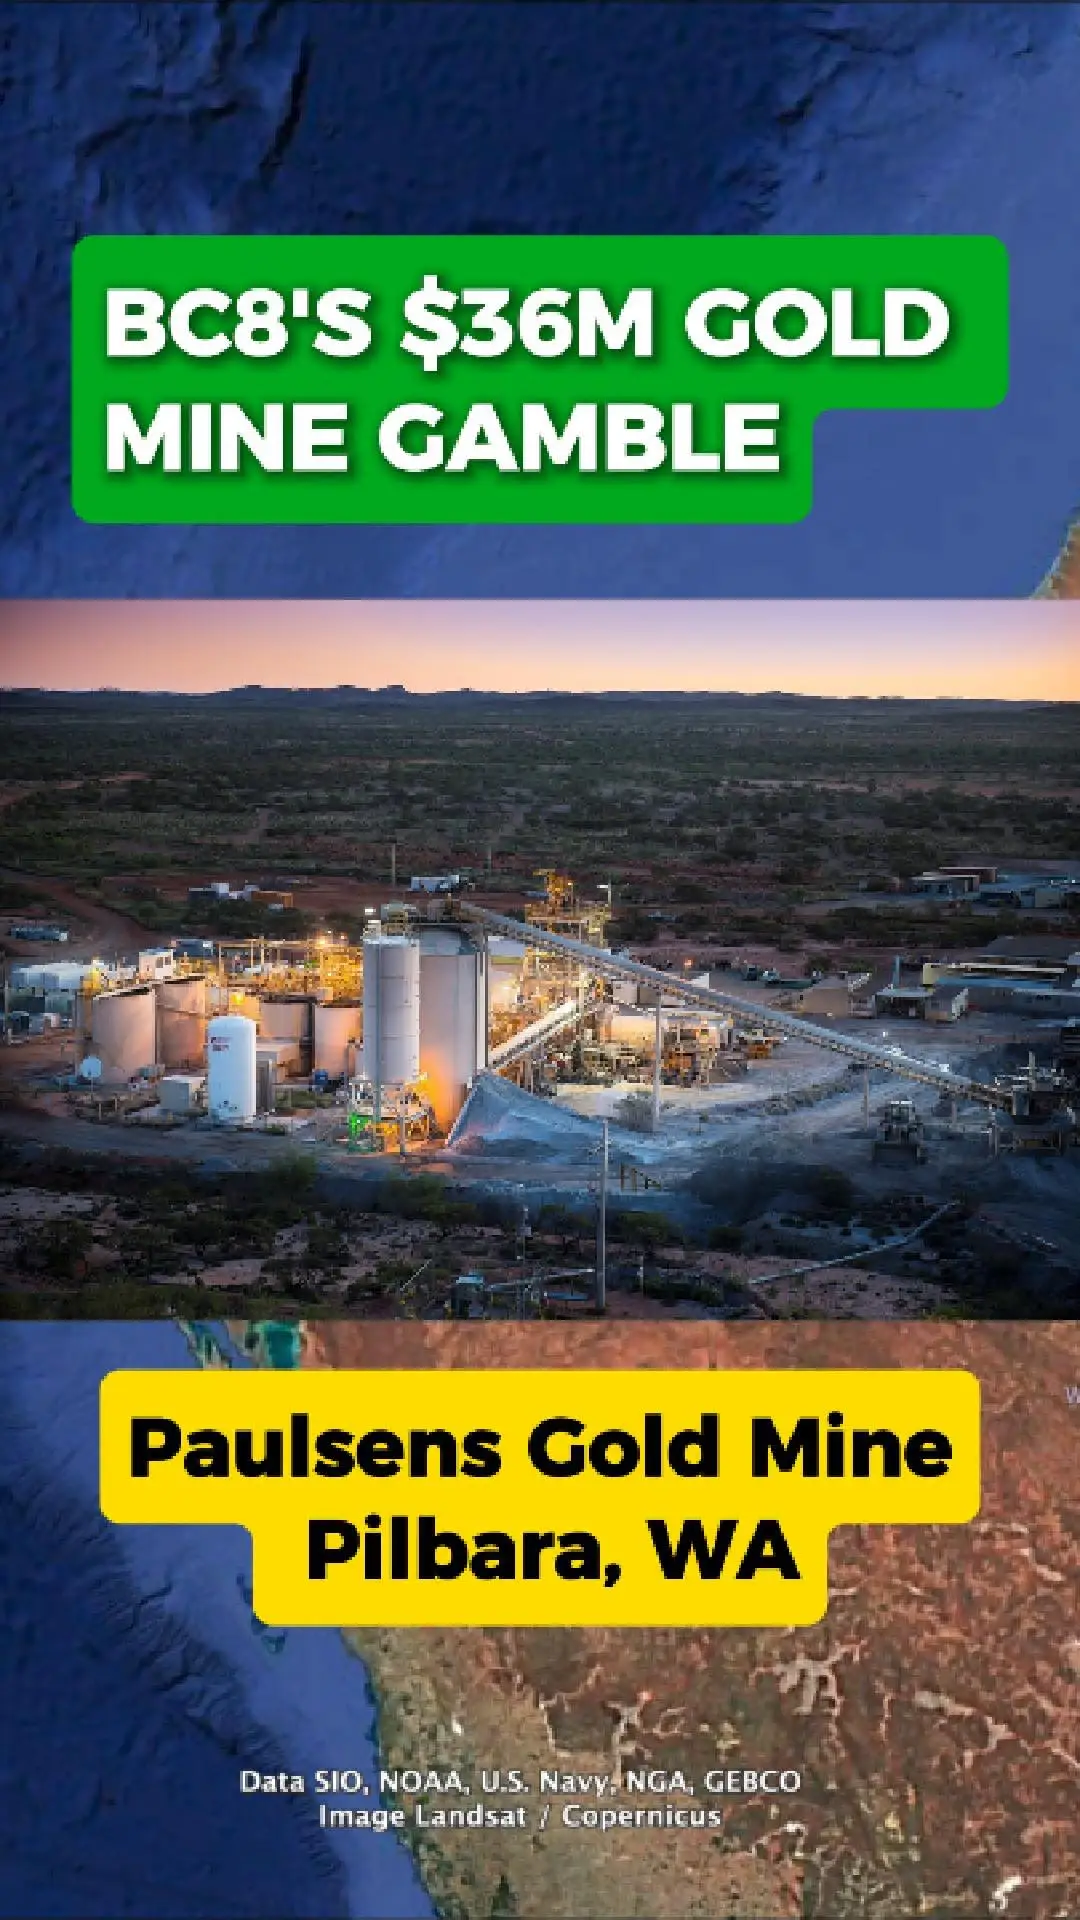
Bc8’S $36m Paulsens Gold Mine Restart: Is The Gamble Paying Off?
Black Cat Syndicate (Asx:Bc8) Committed $36 Million To Restart The Historic Paulsens Gold Mine In Western Australia’S Pilbara Region. The Company’S 2024 Restart Study Pointed To Strong Grades, Improved Mining Plans, And The Potential For A Major Lift In Operating Cashflow.
First Gold Arrives Ahead Of Schedule
By December 2024, Paulsens Had Already Poured Its First Gold Under Black Cat’S Ownership. This Marked A Major Milestone For A Mine That Had Previously Been On Care And Maintenance. Early Production Results Aligned With Expectations And Helped Build Momentum Into 2025.
Drilling Strengthens The Case
Through 2025, Drilling Across The Project Continued To Return Positive Results. New Intercepts Supported Extensions To Known Lodes And Reinforced The Company’S Belief In The Long-Term Potential Of The Paulsens System.
Gold Prices Provide A Tailwind
The Restart Has Come At A Time Of Strong Gold Prices, Giving Black Cat A Favourable Market Backdrop. Higher Margins And Stronger Cashflow Potential Have Helped Make The Restart More Compelling.
New Ground And Ore Deals Add Scale
In Addition To Mine Performance, Black Cat Secured New Exploration Ground And Ore-Supply Agreements With Dreadnought Resources. These Deals Give Paulsens Additional Feed Flexibility And Strengthen The Project’S Growth Pathway.
Is The $36m Gamble Working?
Early Signs Suggest The Restart Is Tracking Well: Gold Poured, Positive Drilling, Growing Production, And Supportive Market Conditions. While It’S Still Early In The Mine’S New Life, The Combination Of Grade, Scale, And Partnerships Indicates The Paulsens Comeback May Only Just Be Beginning.
 ASX:BC8
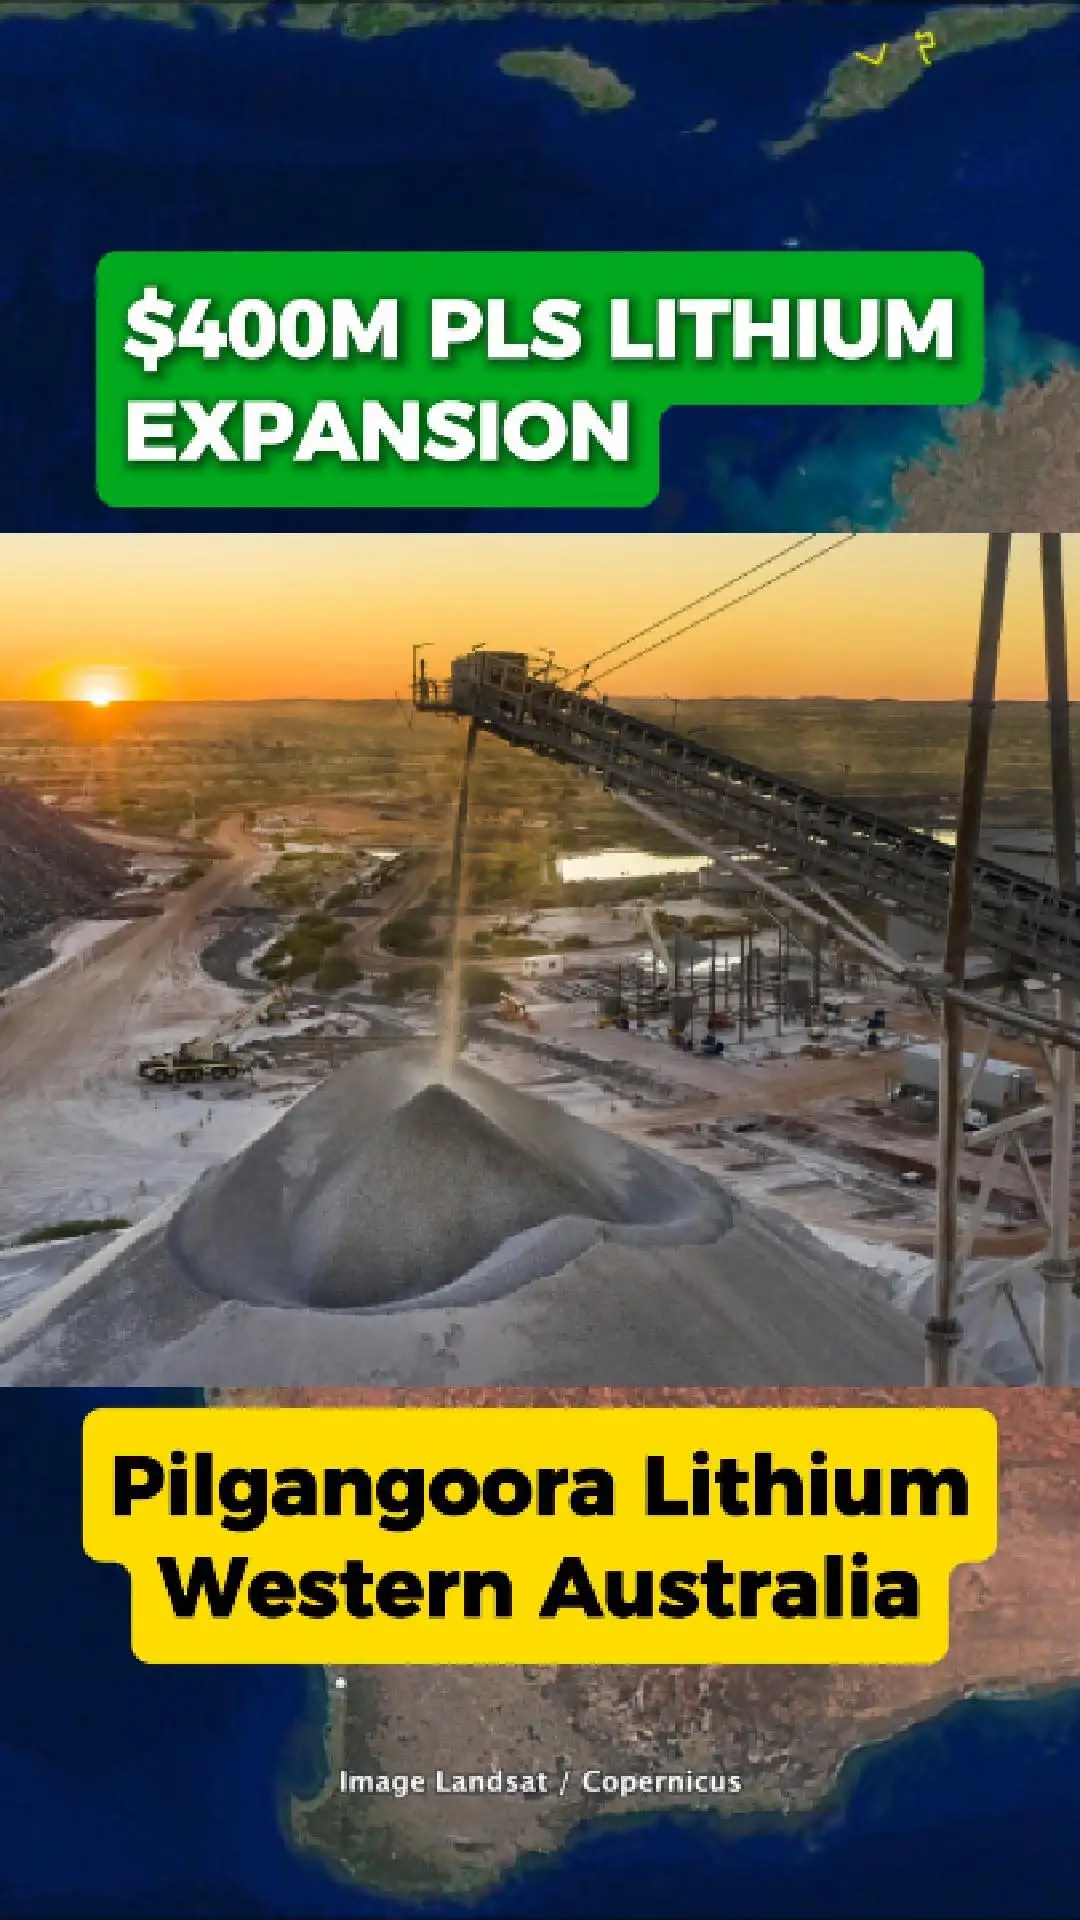
Pilbara Minerals’ $400m Lithium Expansion: One Year On
Pilbara Minerals Has Now Passed The One-Year Mark Since Completing Its $404 Million P680 Expansion At The Pilgangoora Lithium Mine In Western Australia. The Project Delivered A Huge Boost To Site Capacity, Including The Installation Of The World’S Largest Lithium Ore Sorter And A Brand-New Crushing Facility.
What The Upgrade Was Designed To Do
The P680 Expansion Was Built To Lift Production By Around 30%, Improve Ore Recovery, And Reduce Waste. It Also Forms A Key Step In Pilbara Minerals’ Longer-Term Plan To Grow Pilgangoora Toward A 1 Million Tonne Per Annum Operation Through Future Expansions.
Government Support And Jobs
The Project Was Backed By $250 Million In Government Loans Through Export Finance Australia And The Northern Australia Infrastructure Facility. Construction Created More Than 350 Jobs, With Ongoing Roles Added As The Mine’S Capacity Increased.
A Year Later — Is It Paying Off?
With Lithium Markets Shifting Rapidly Over The Past 12 Months, Many Investors Are Asking Whether This Major Upgrade Is Delivering The Results Pilbara Minerals Expected. Early Signs Suggest Improved Throughput, Stronger Operational Efficiency, And A Foundation For Future Growth — But The Company’S Long-Term Performance Will Depend On Market Conditions And The Planned Transition Toward The Larger P1000 Expansion.
A Critical Asset For Wa’S Lithium Future
What’S Clear Is That Pilgangoora Remains One Of The World’S Most Significant Hard-Rock Lithium Operations. The P680 Upgrade Has Strengthened Its Position And Given Pilbara Minerals More Flexibility As Global Demand For Battery Minerals Evolves.
ASX:PLS
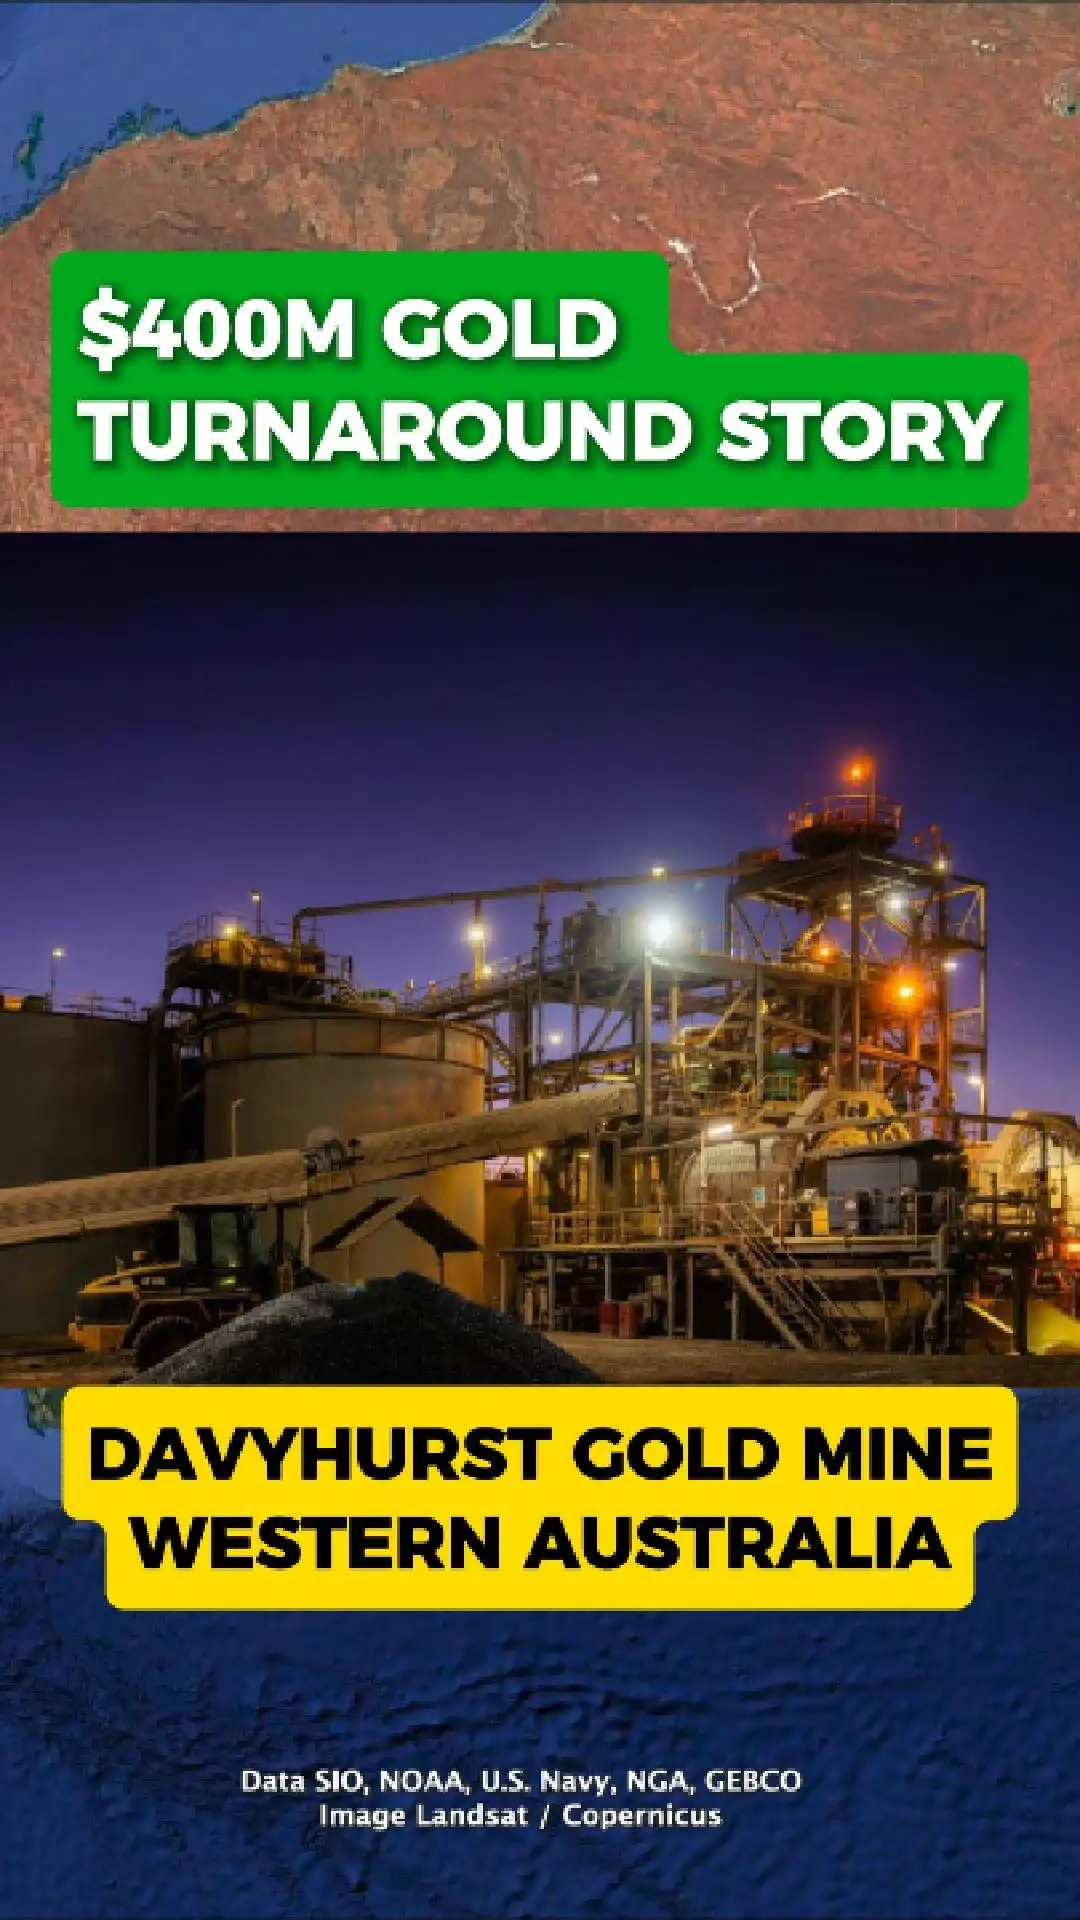
Davyhurst Gold Mine Ramps Up After Turnaround
The Davyhurst Gold Mine In Western Australia Was Once Seen As A Challenged Operation. After A Period Of Underperformance, The Mine Has Now Returned To Growth Following A Major Operational Reset.
Operations Back On Track
Ora Banda Mining Cleaned Up Its Mining And Processing Operations, Improving Reliability And Lifting Gold Output. These Changes Helped Stabilise Production And Improve Overall Performance At The Site.
Strong Financial Results
In 2025, The Company Sold More Than $400 Million Worth Of Gold, Delivering $186 Million In Profit. The Result Reflects Higher Production Levels And Improved Operating Efficiency.
Growth Ahead
With Production Expected To More Than Double By Next Year, Davyhurst Is Entering A New Phase. The Focus Has Shifted From Fixing Problems To Scaling Production, Raising Questions About How Large The Operation Could Become.
ASX:OBM
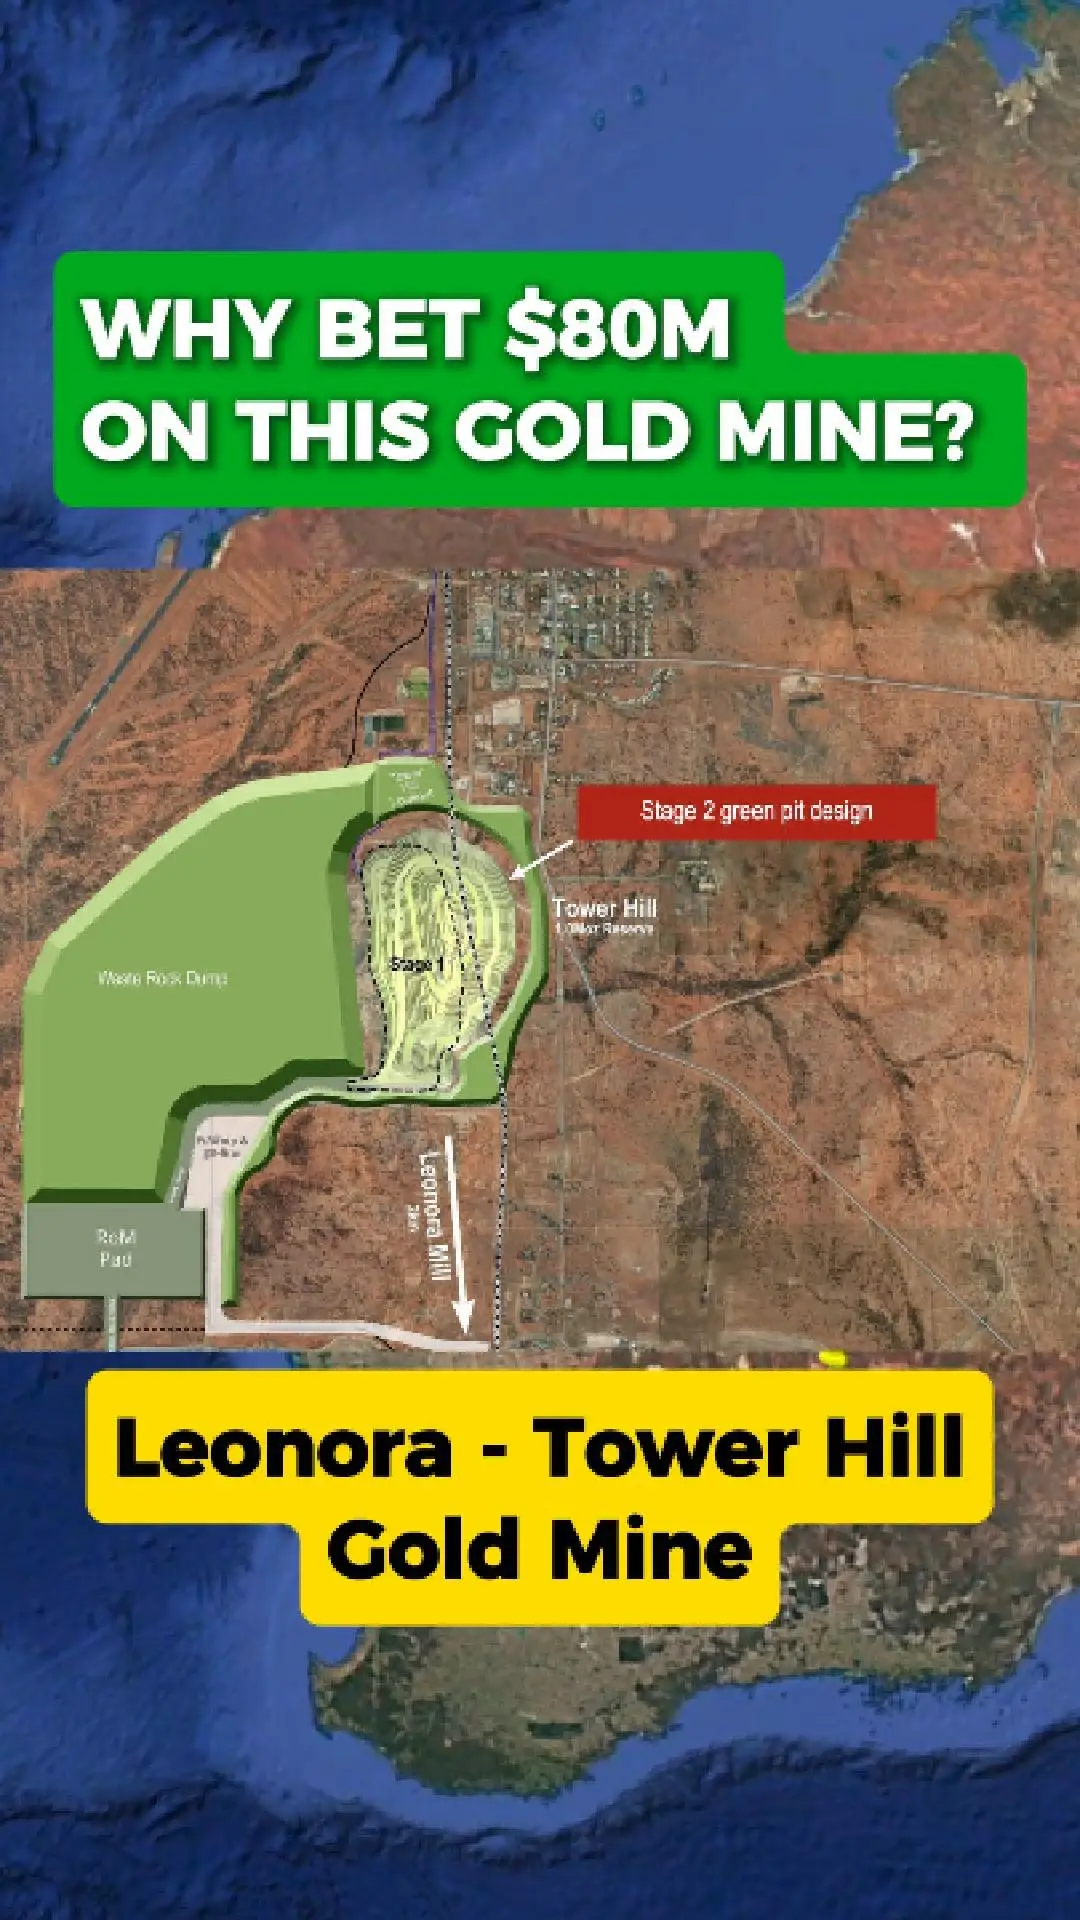
Why Bet $80 Million On This Gold Mine?
Genesis Minerals Is Accelerating Work At Tower Hill — A Major Gold Deposit Just Outside Leonora In Western Australia — As The Company Moves Closer To Full-Scale Development. With Gold Prices Trading Near Record Highs, The Project Has Quickly Become One Of Wa’S Most-Watched Growth Stories.
Shifting The Rail To Unlock The Pit
One Of The Most Significant Steps Is The Plan To Relocate The Nearby Rail Line. This Allows Genesis To Expand The Mill And Open Up The Full Extent Of The Tower Hill Pit — Something Previous Owners Couldn’T Realistically Do. The Move Clears The Way For A Larger, More Efficient Operation Tied Directly Into Genesis’ Leonora Production Hub.
High-Grade Hits Continue
Recent Drilling Around Tower Hill Has Returned Consistent High-Grade Intercepts, Strengthening Confidence In The Resource And Supporting Plans For A Much Larger Mine Footprint. These Results Also Feed Into An Expanded Underground Study Now Underway.
A New Gold Hub In The Making?
With Planned Capital Spending Around The $80 Million Mark, A Strong Gold Market, And A District-Scale Strategy Connecting Multiple Deposits, Investors Are Watching Closely. If The Development Plan Lands As Expected, Tower Hill Could Become Wa’S Next Major Gold Success Story — And A Key Pillar In Genesis Minerals’ Leonora Growth Plans.
ASX:GMD
$AAI
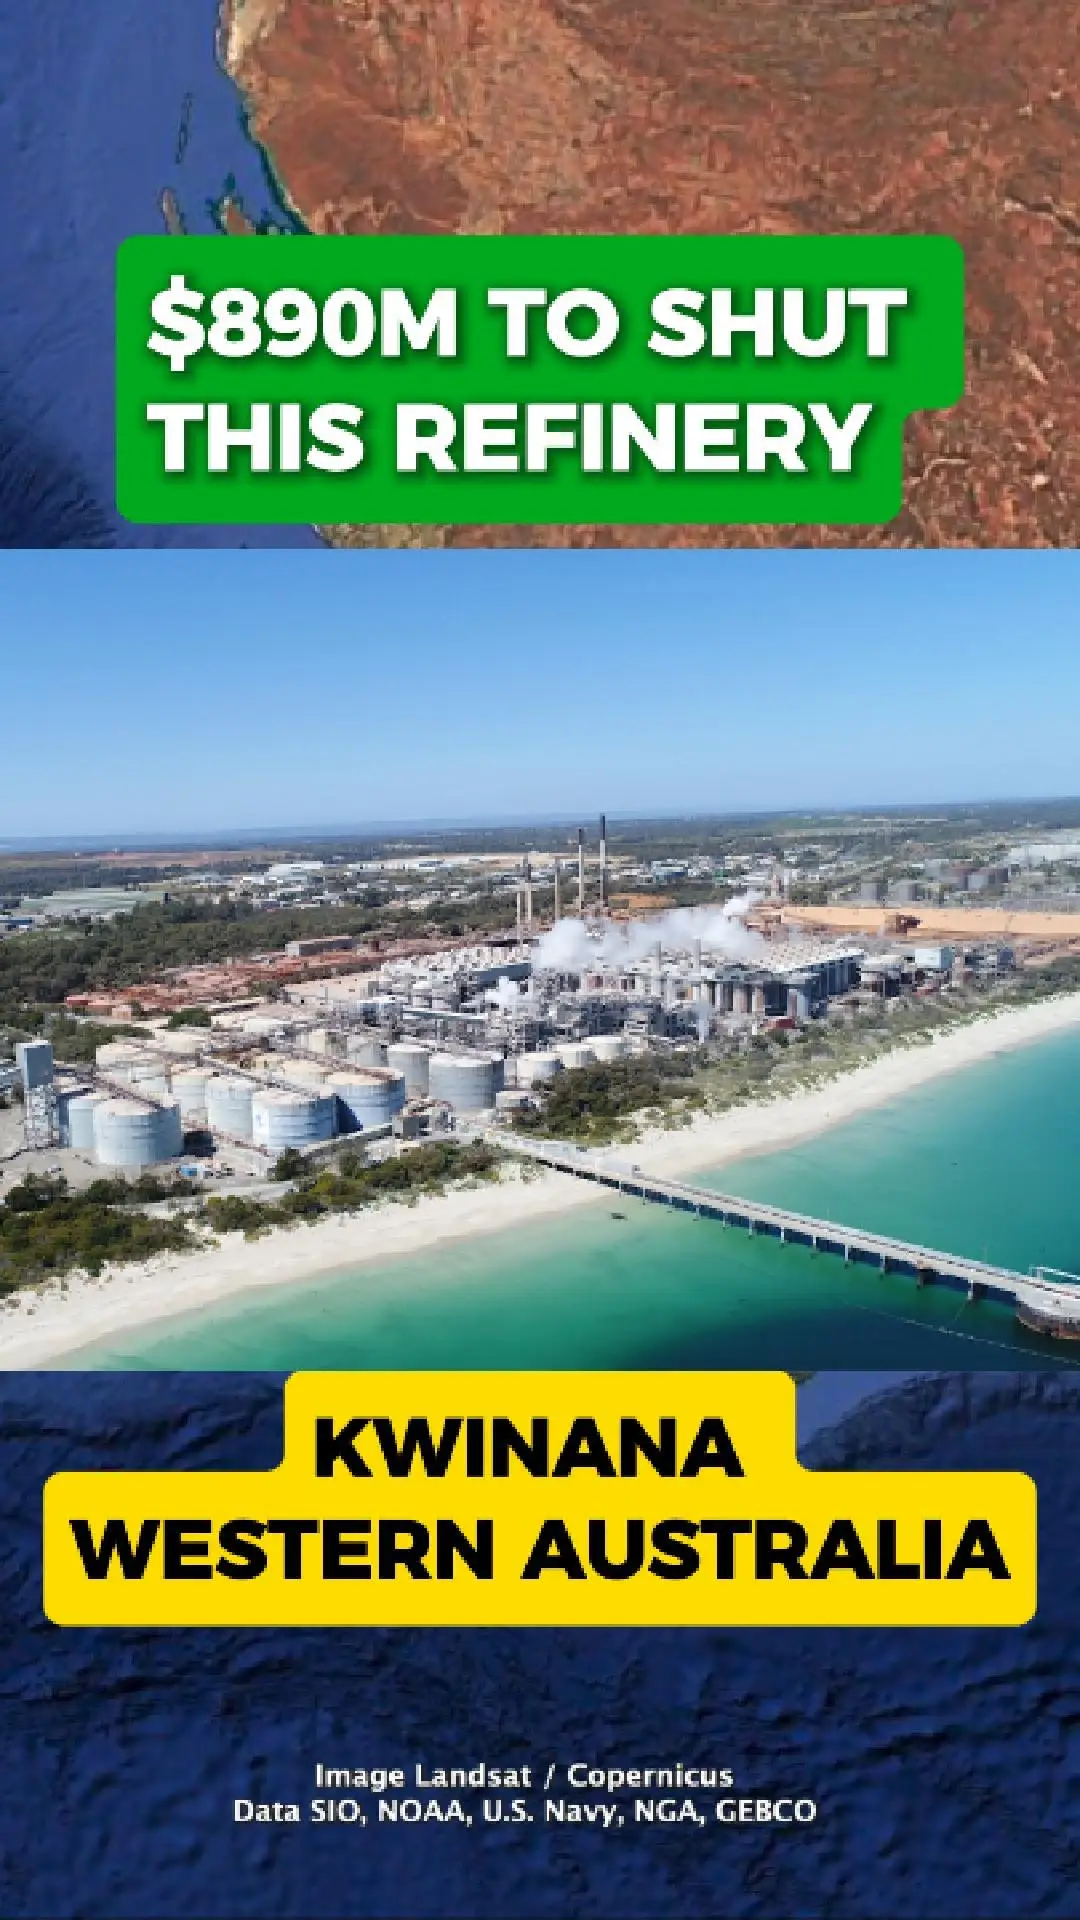
Kwinana Refinery to Close After 60 Years
The Kwinana alumina refinery in Western Australia is closing permanently after more than six decades of operation. The facility has been a major part of the local industrial landscape since the 1960s.
Why It’s Closing
Alcoa says the refinery is too old, too expensive to run, ...
The Kwinana alumina refinery in Western Australia is closing permanently after more than six decades of operation. The facility has been a major part of the local industrial landscape since the 1960s.
Why It’s Closing
Alcoa says the refinery is too old, too expensive to run, ...
$CMM
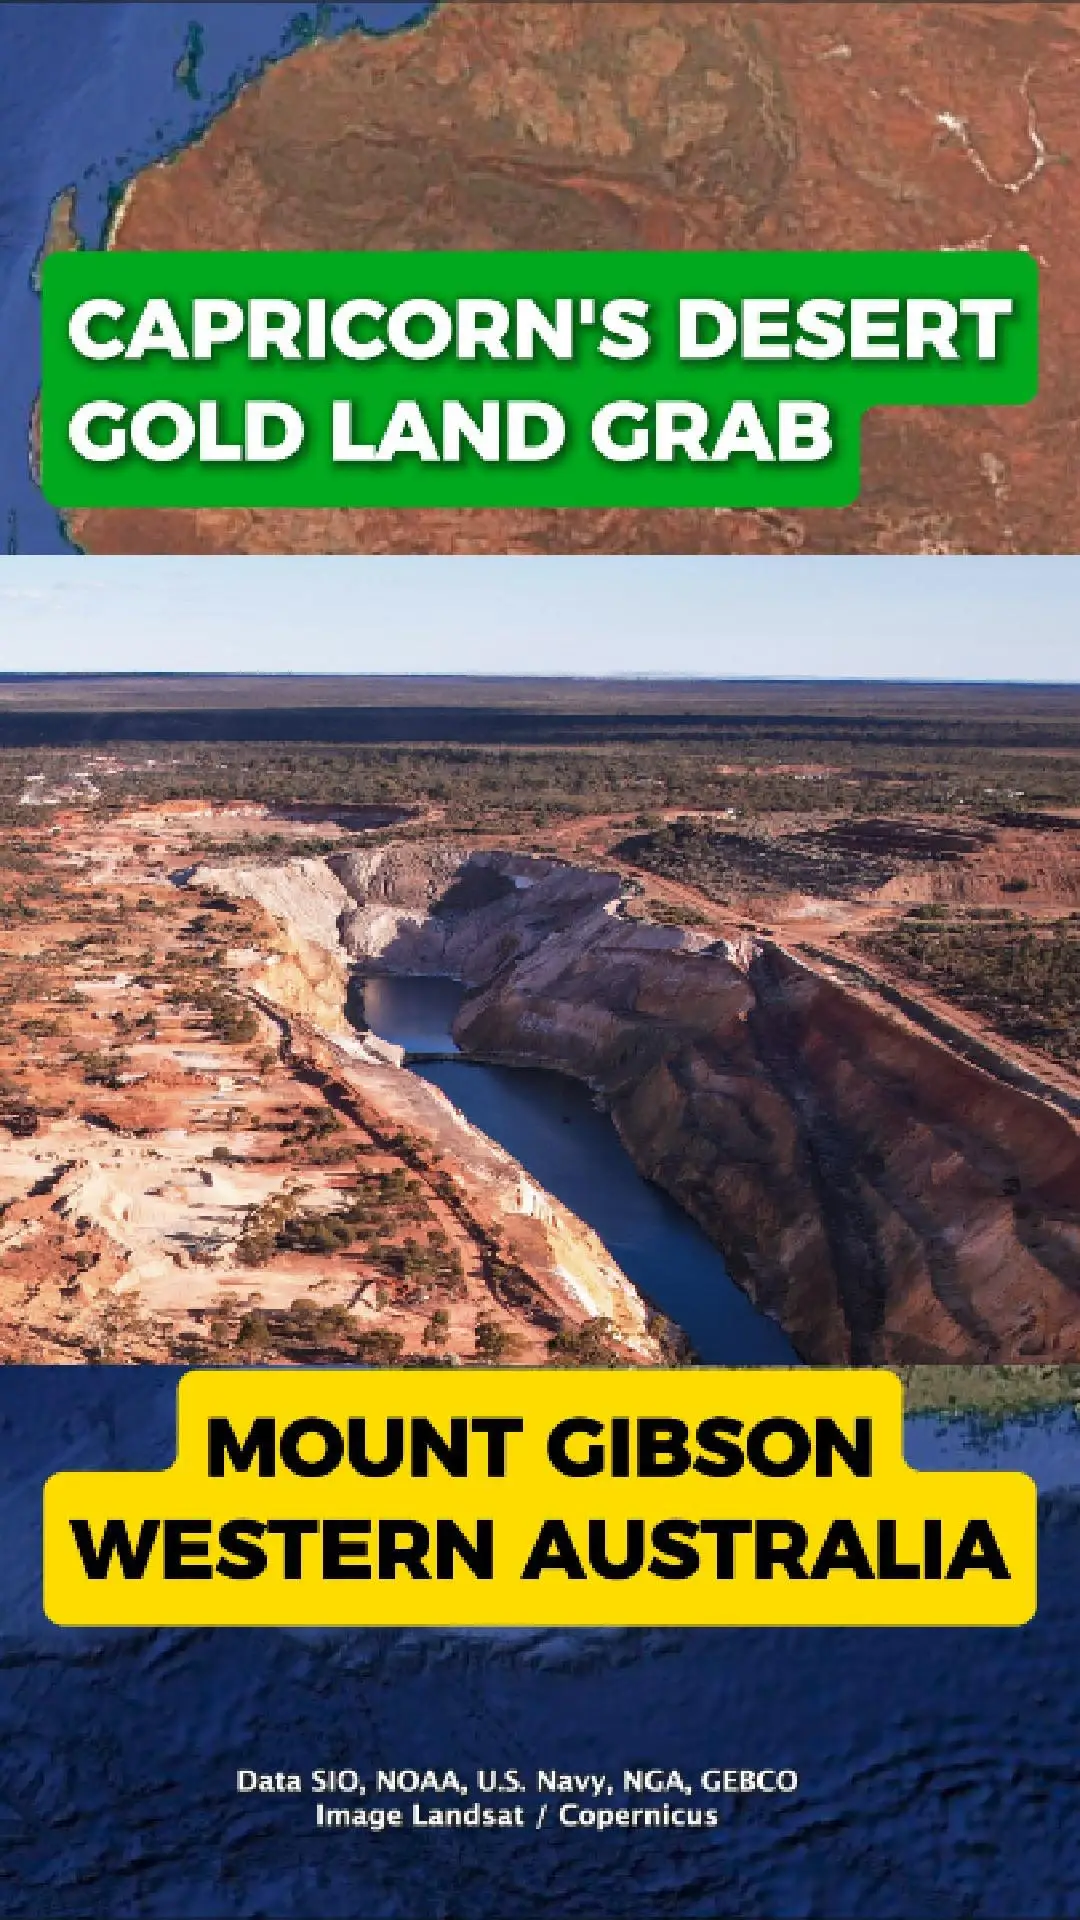
Capricorn Expands in Mount Gibson Gold District
Capricorn Metals has made a low-key Christmas acquisition in Western Australia’s Mount Gibson gold district, strengthening its regional footprint.
The company has agreed to buy the nearby Yalgoo project for $4.5 million, adding around 1,000 square kilometres of prospective ground to its existing exploration holdings.
Strengthening ...
$OBM
Davyhurst Gold Mine Ramps Up After Turnaround
The Davyhurst Gold Mine in Western Australia was once seen as a challenged operation. After a period of underperformance, the mine has now returned to growth following a major operational reset.
Operations Back on Track
Ora Banda Mining cleaned up its mining and processing operations, improving ...
The Davyhurst Gold Mine in Western Australia was once seen as a challenged operation. After a period of underperformance, the mine has now returned to growth following a major operational reset.
Operations Back on Track
Ora Banda Mining cleaned up its mining and processing operations, improving ...
$POL
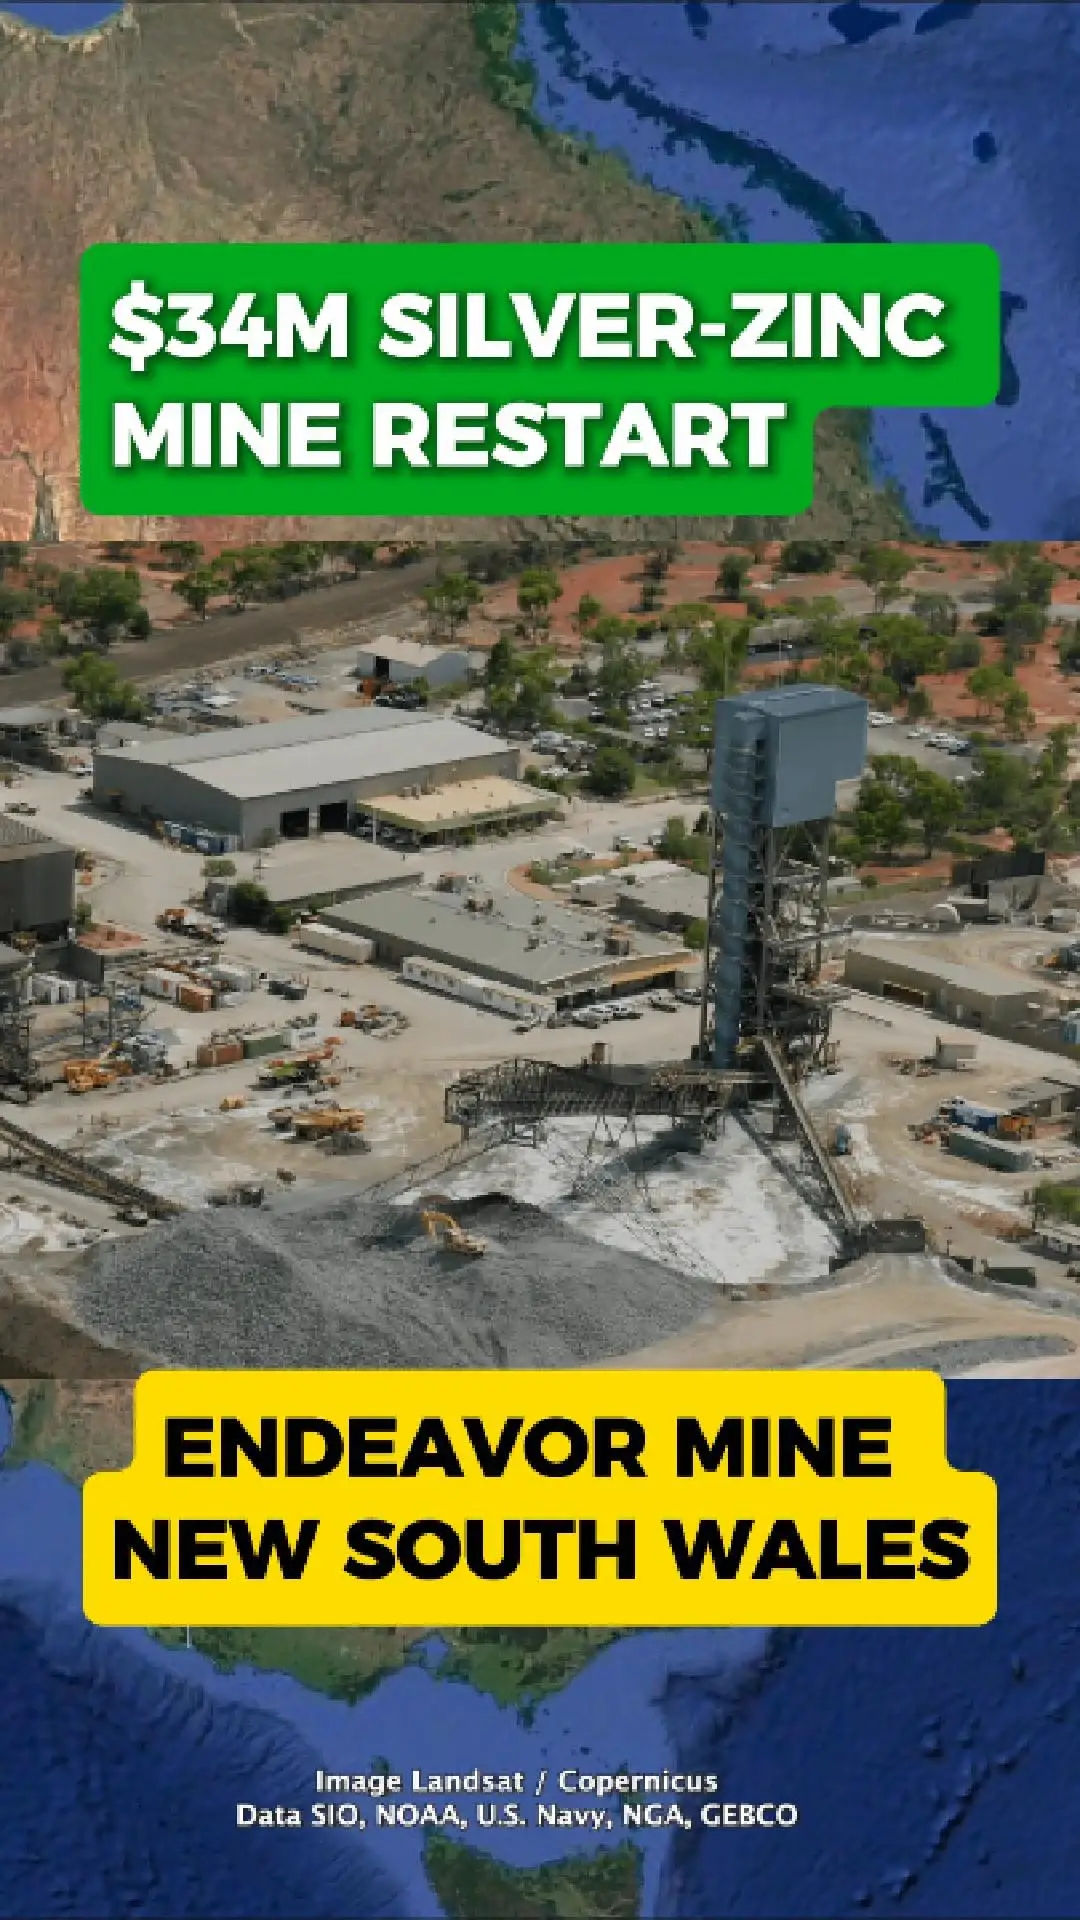
Polymetals Raises Funds to Ramp Up Endeavor Mine
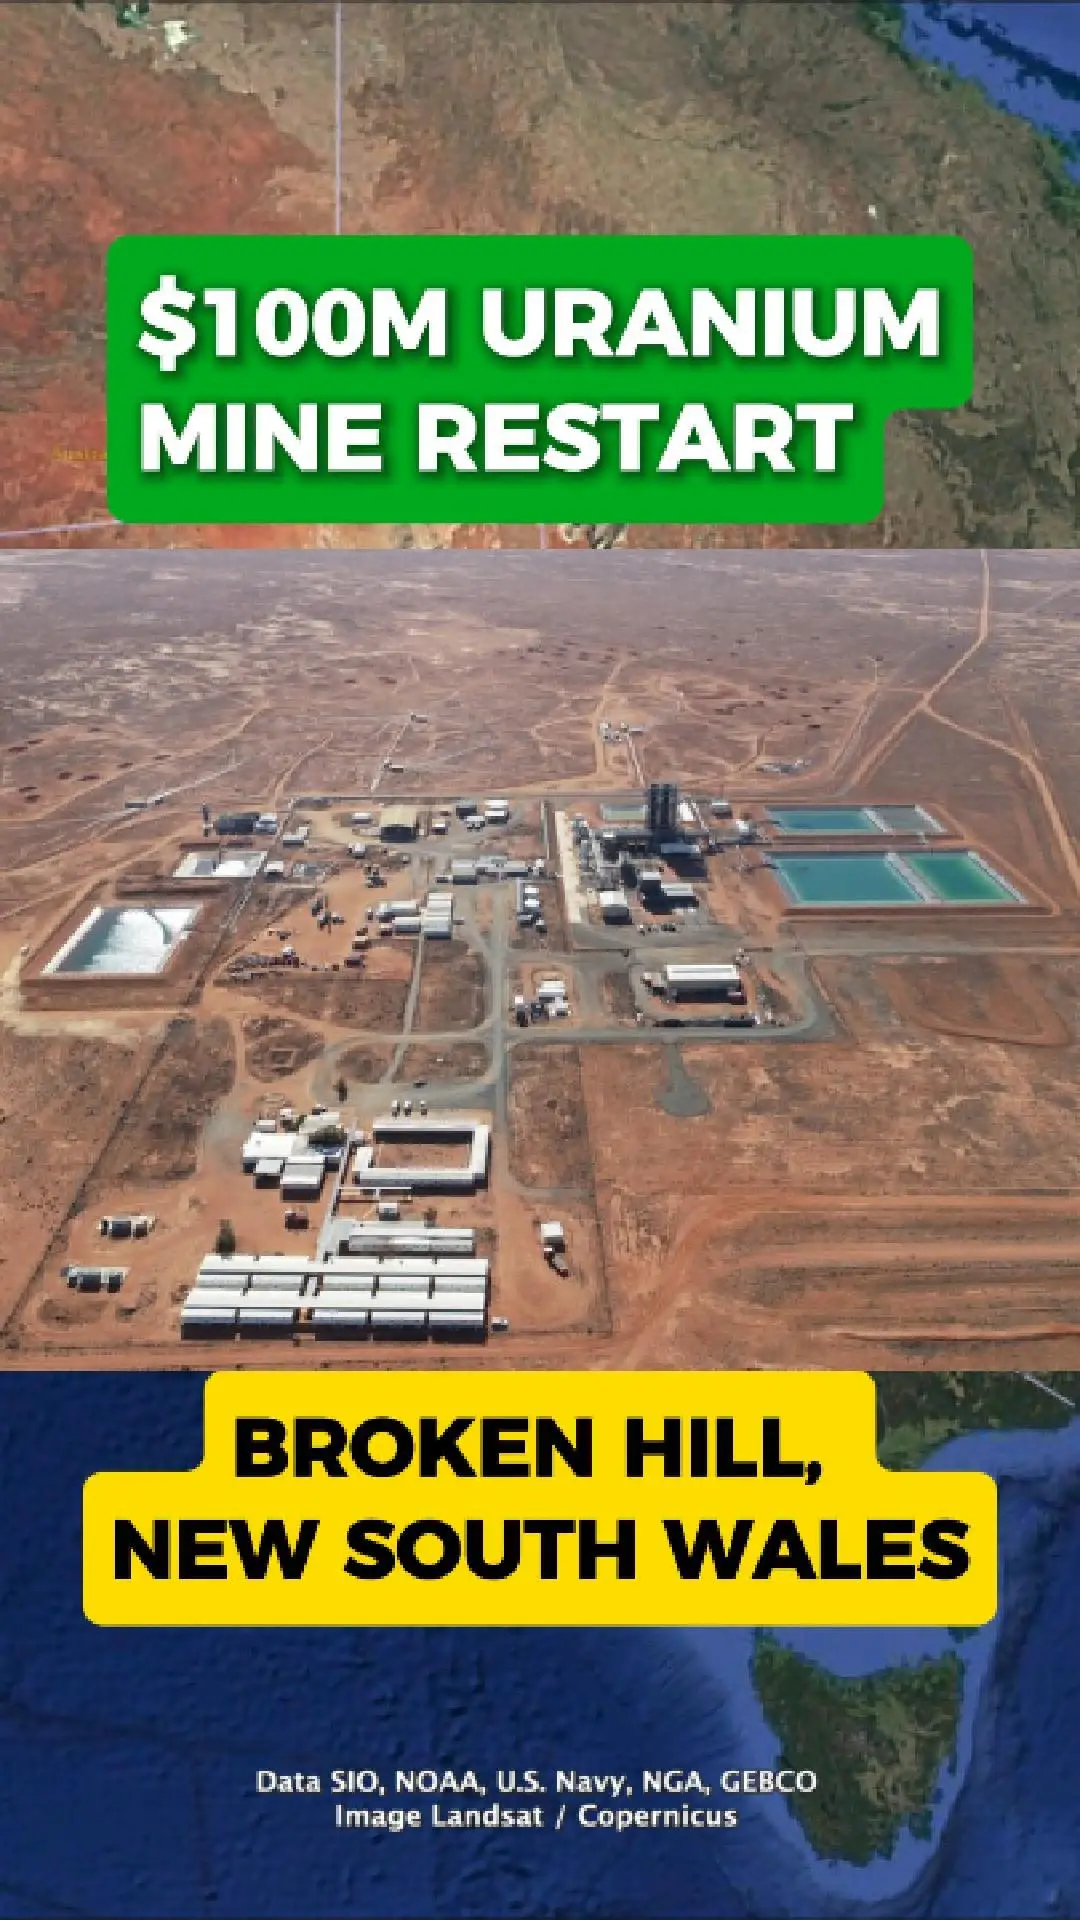
The Endeavor mine in outback New South Wales is ramping back into production after a period of inactivity. The historic silver-zinc operation has recently restarted, with mining activity building as the site returns to steady operations.
$34 Million Capital Raise
Polymetals Resources has raised more ...
$GG8
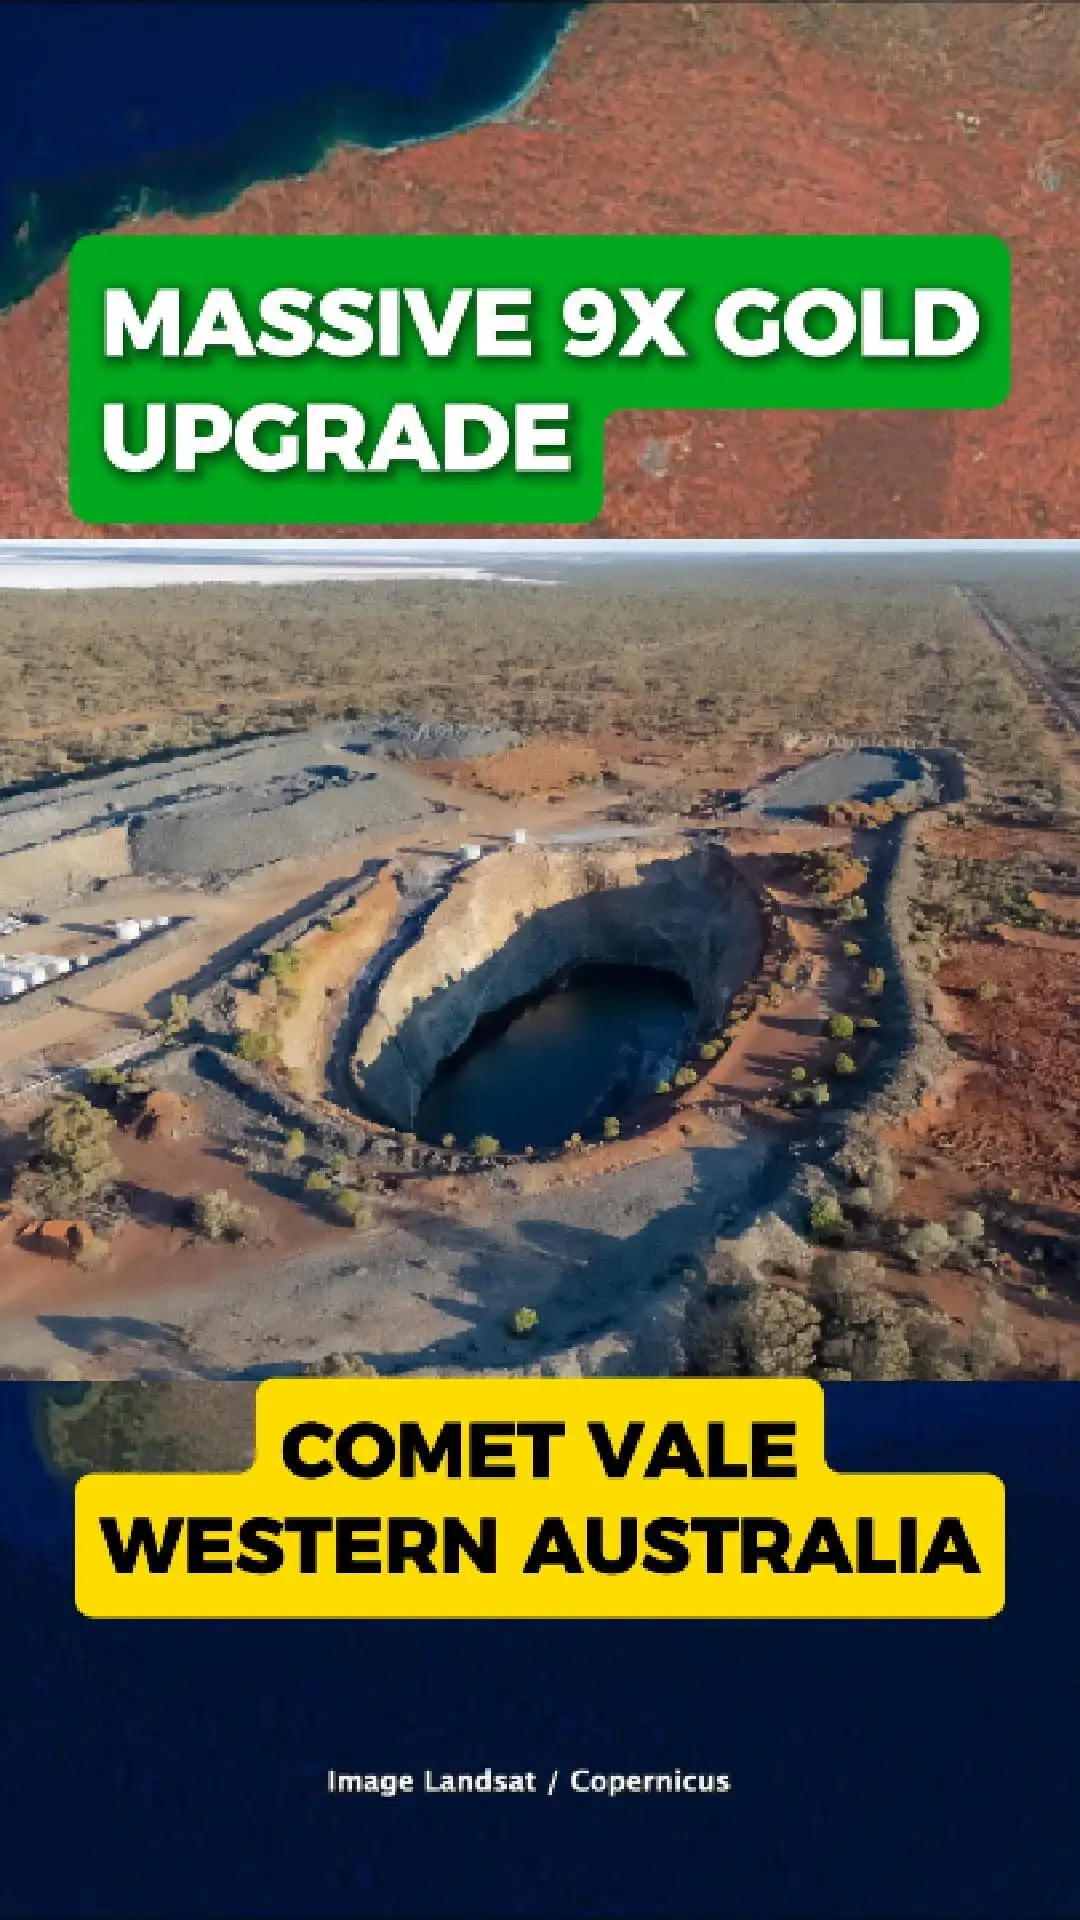
Comet Vale Gold Project Scales Up in Western Australia
The Comet Vale gold project in Western Australia, once a quiet and largely forgotten mine, is back in focus as drilling activity ramps up across the site. What was previously a small resource has now grown significantly following a year of sustained ...
The Comet Vale gold project in Western Australia, once a quiet and largely forgotten mine, is back in focus as drilling activity ramps up across the site. What was previously a small resource has now grown significantly following a year of sustained ...
$WC8
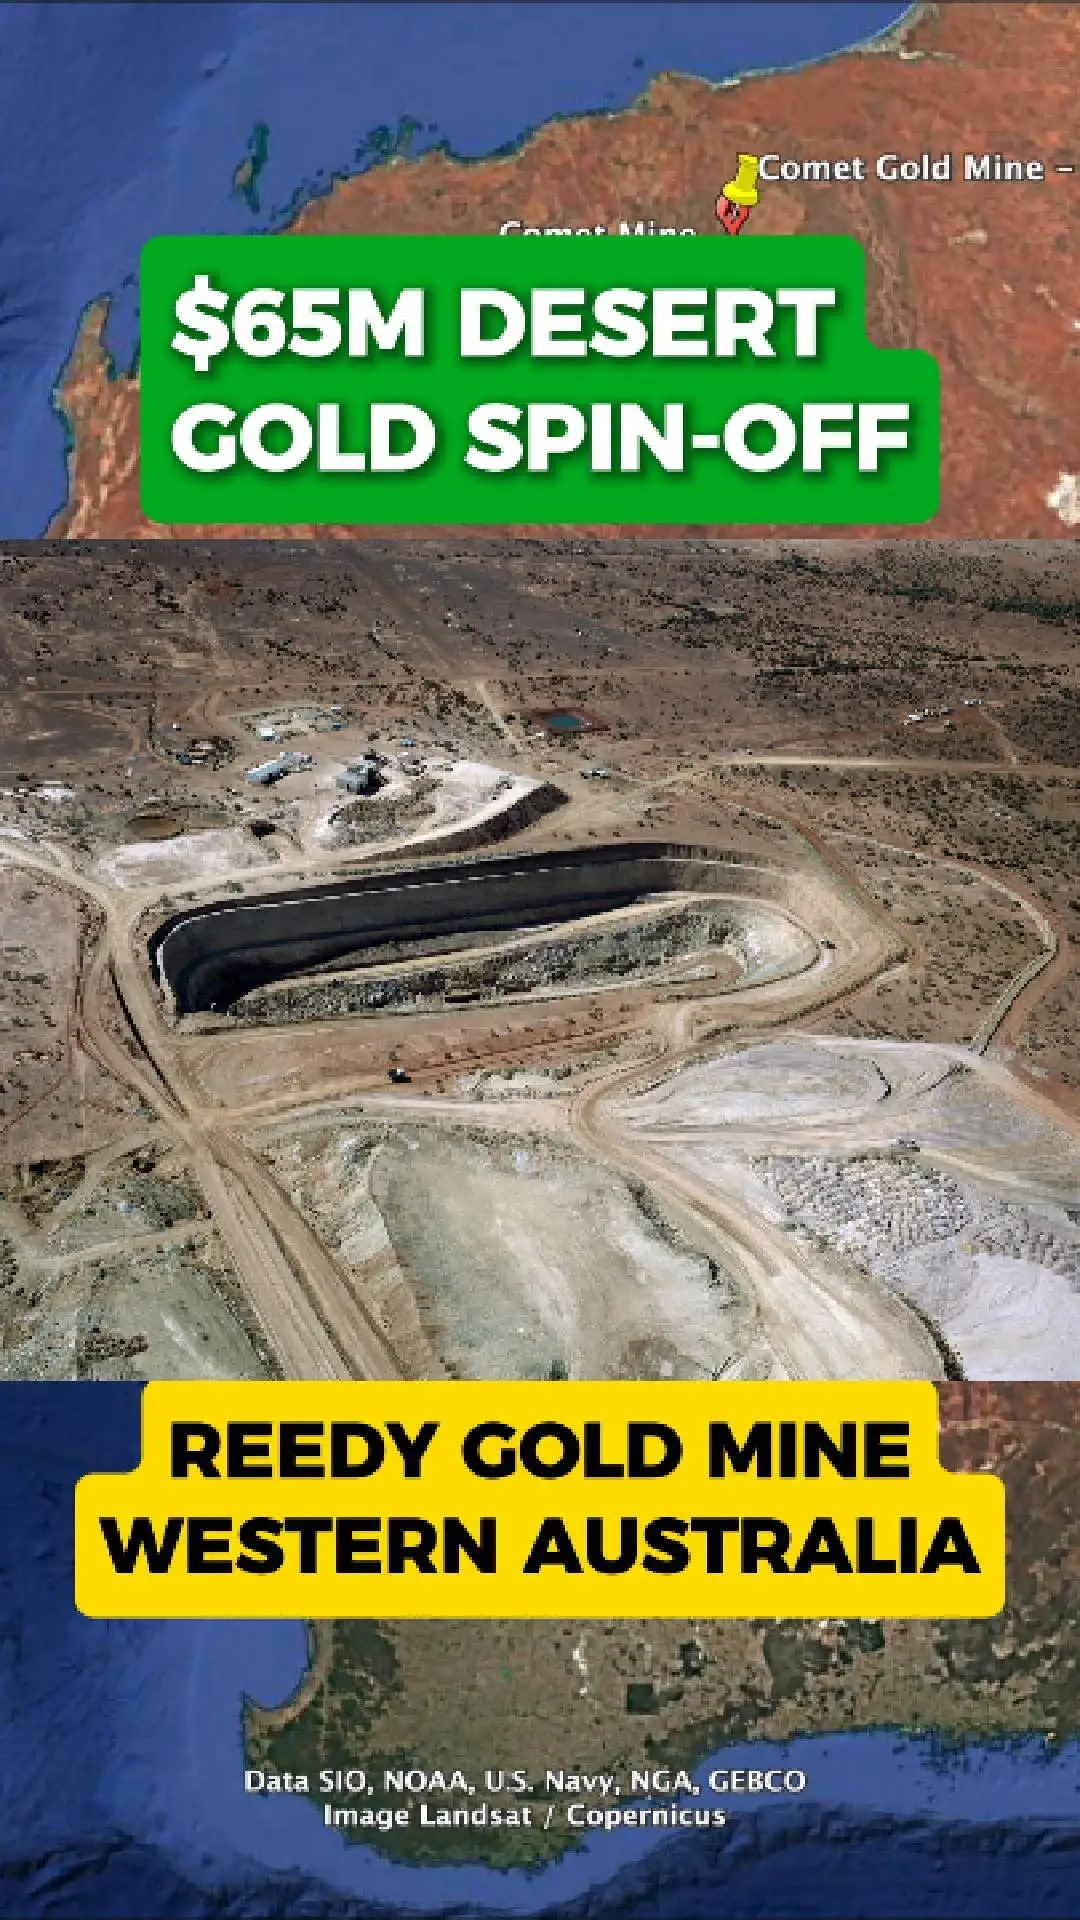
Reedy Gold Mine Set for New Chapter
The old Reedy Gold Mine in Western Australia is set to get a second chance, following a major corporate restructure by Westgold Resources.
Westgold has announced plans to spin out the Reedy project, along with the nearby Comet project, into a new ASX-listed company called ...
The old Reedy Gold Mine in Western Australia is set to get a second chance, following a major corporate restructure by Westgold Resources.
Westgold has announced plans to spin out the Reedy project, along with the nearby Comet project, into a new ASX-listed company called ...
$MIN
MinRes Expands Onslow Iron With $3.5B Build
Ken’s Bore mine near Onslow was once empty red desert. Today, it sits at the centre of one of Australia’s largest new iron-ore developments, as Mineral Resources continues to scale up its Onslow Iron project in Western Australia.
New Mines, Port and Haul Road
MinRes is ...
Ken’s Bore mine near Onslow was once empty red desert. Today, it sits at the centre of one of Australia’s largest new iron-ore developments, as Mineral Resources continues to scale up its Onslow Iron project in Western Australia.
New Mines, Port and Haul Road
MinRes is ...

$BHP
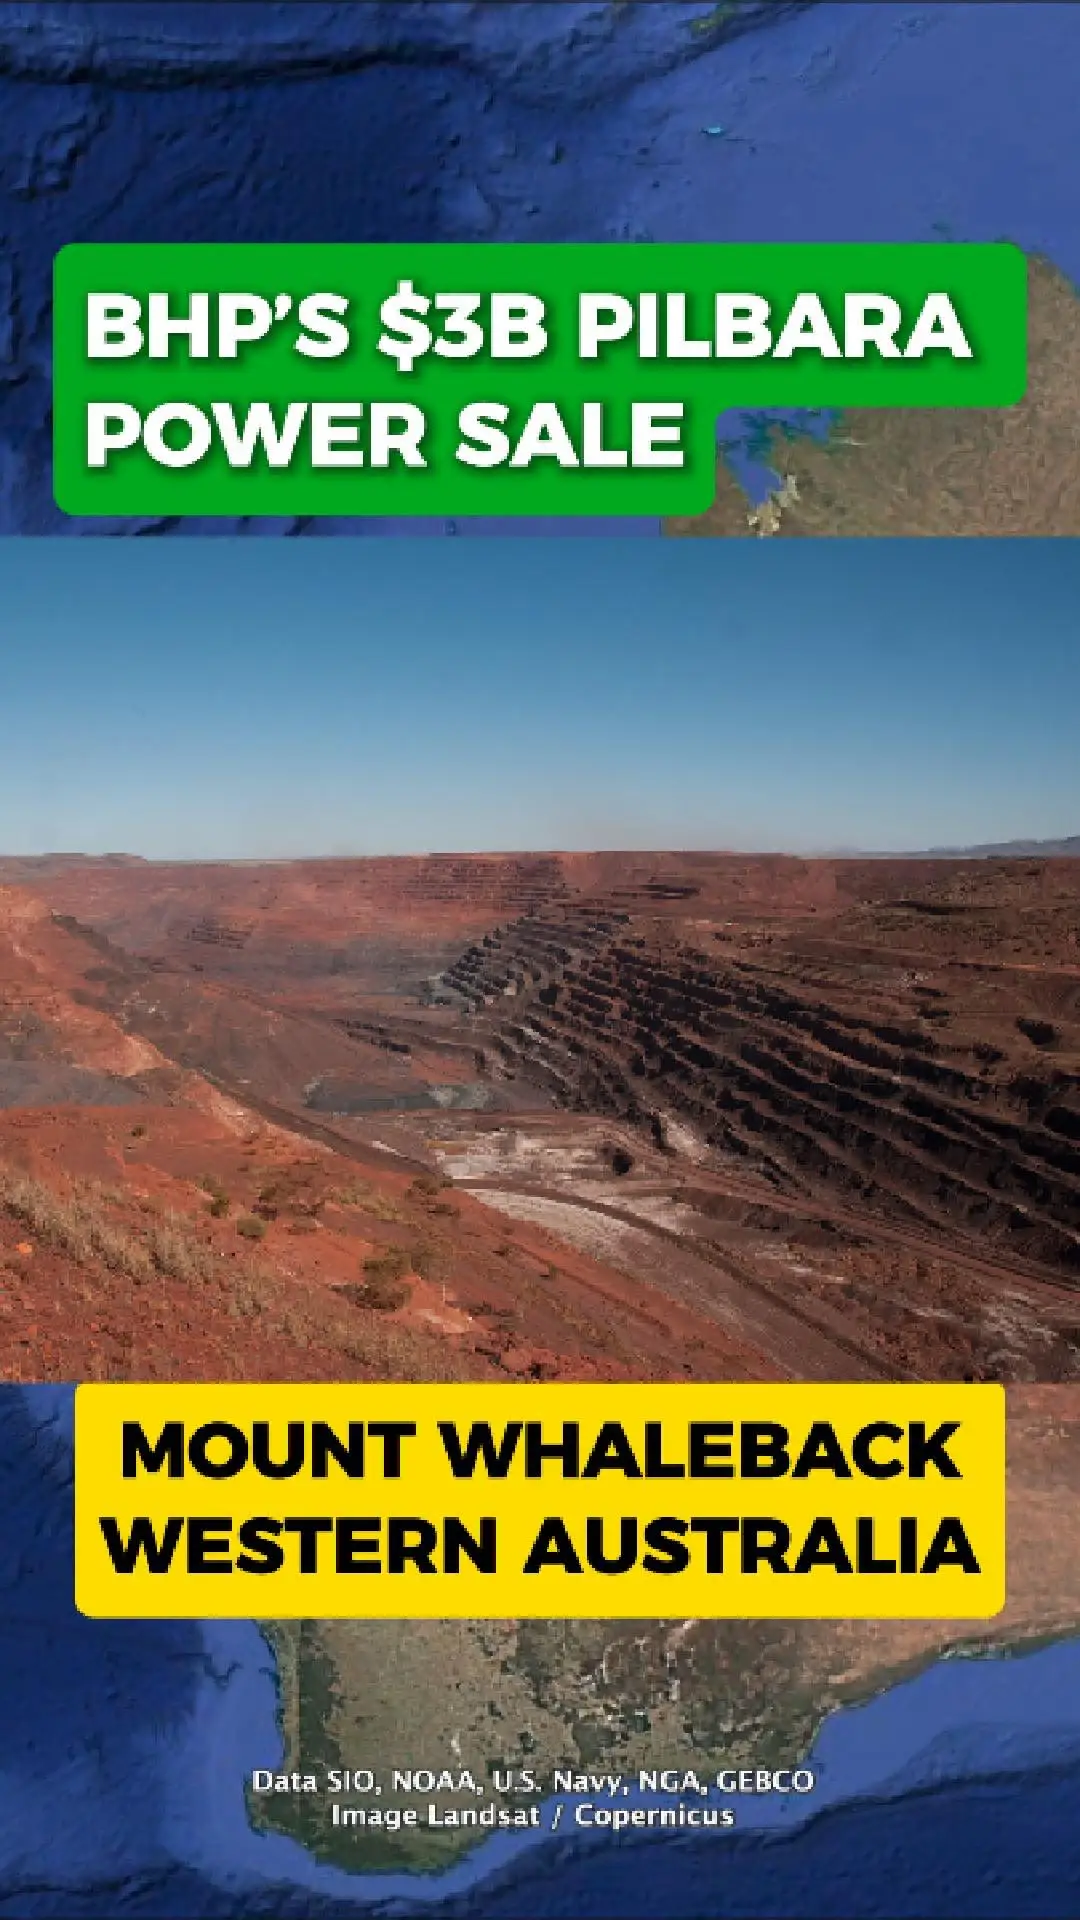
BHP Sells $3B Stake in Pilbara Power Network
Mount Whaleback — one of the world’s largest open-cut iron-ore mines — depends on a vast inland power network that keeps crushers, haul roads and remote camps running across the Pilbara.
This network supplies electricity not only to Mount Whaleback, but to BHP’s broader ...
Mount Whaleback — one of the world’s largest open-cut iron-ore mines — depends on a vast inland power network that keeps crushers, haul roads and remote camps running across the Pilbara.
This network supplies electricity not only to Mount Whaleback, but to BHP’s broader ...
$FEX
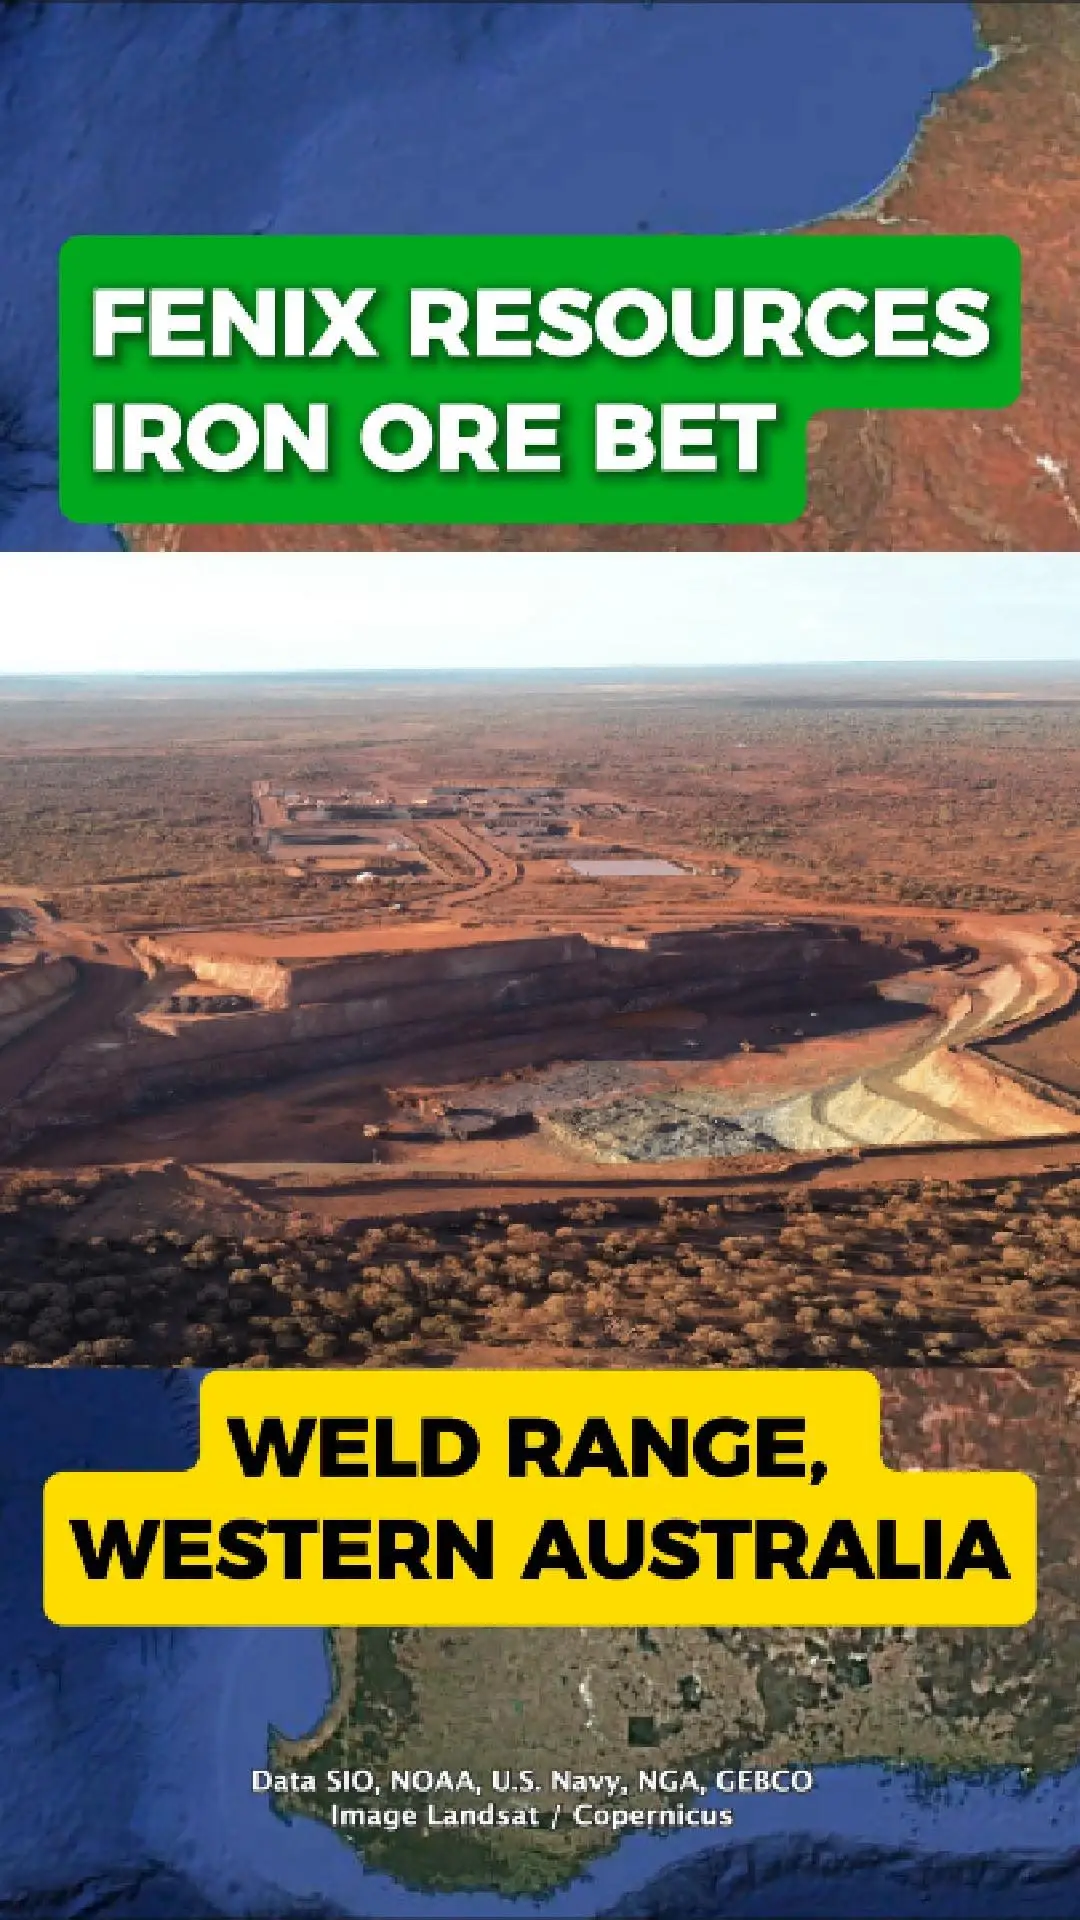
Fenix Shifts Iron Ore Focus to Weld Range
Every year, millions of tonnes of iron ore leave Western Australia’s red desert, feeding global steel markets. Now Fenix Resources is repositioning its iron ore operations, placing the Weld Range at the centre of its future production plans.
As the company’s earlier pits begin ...
Every year, millions of tonnes of iron ore leave Western Australia’s red desert, feeding global steel markets. Now Fenix Resources is repositioning its iron ore operations, placing the Weld Range at the centre of its future production plans.
As the company’s earlier pits begin ...
$WC8
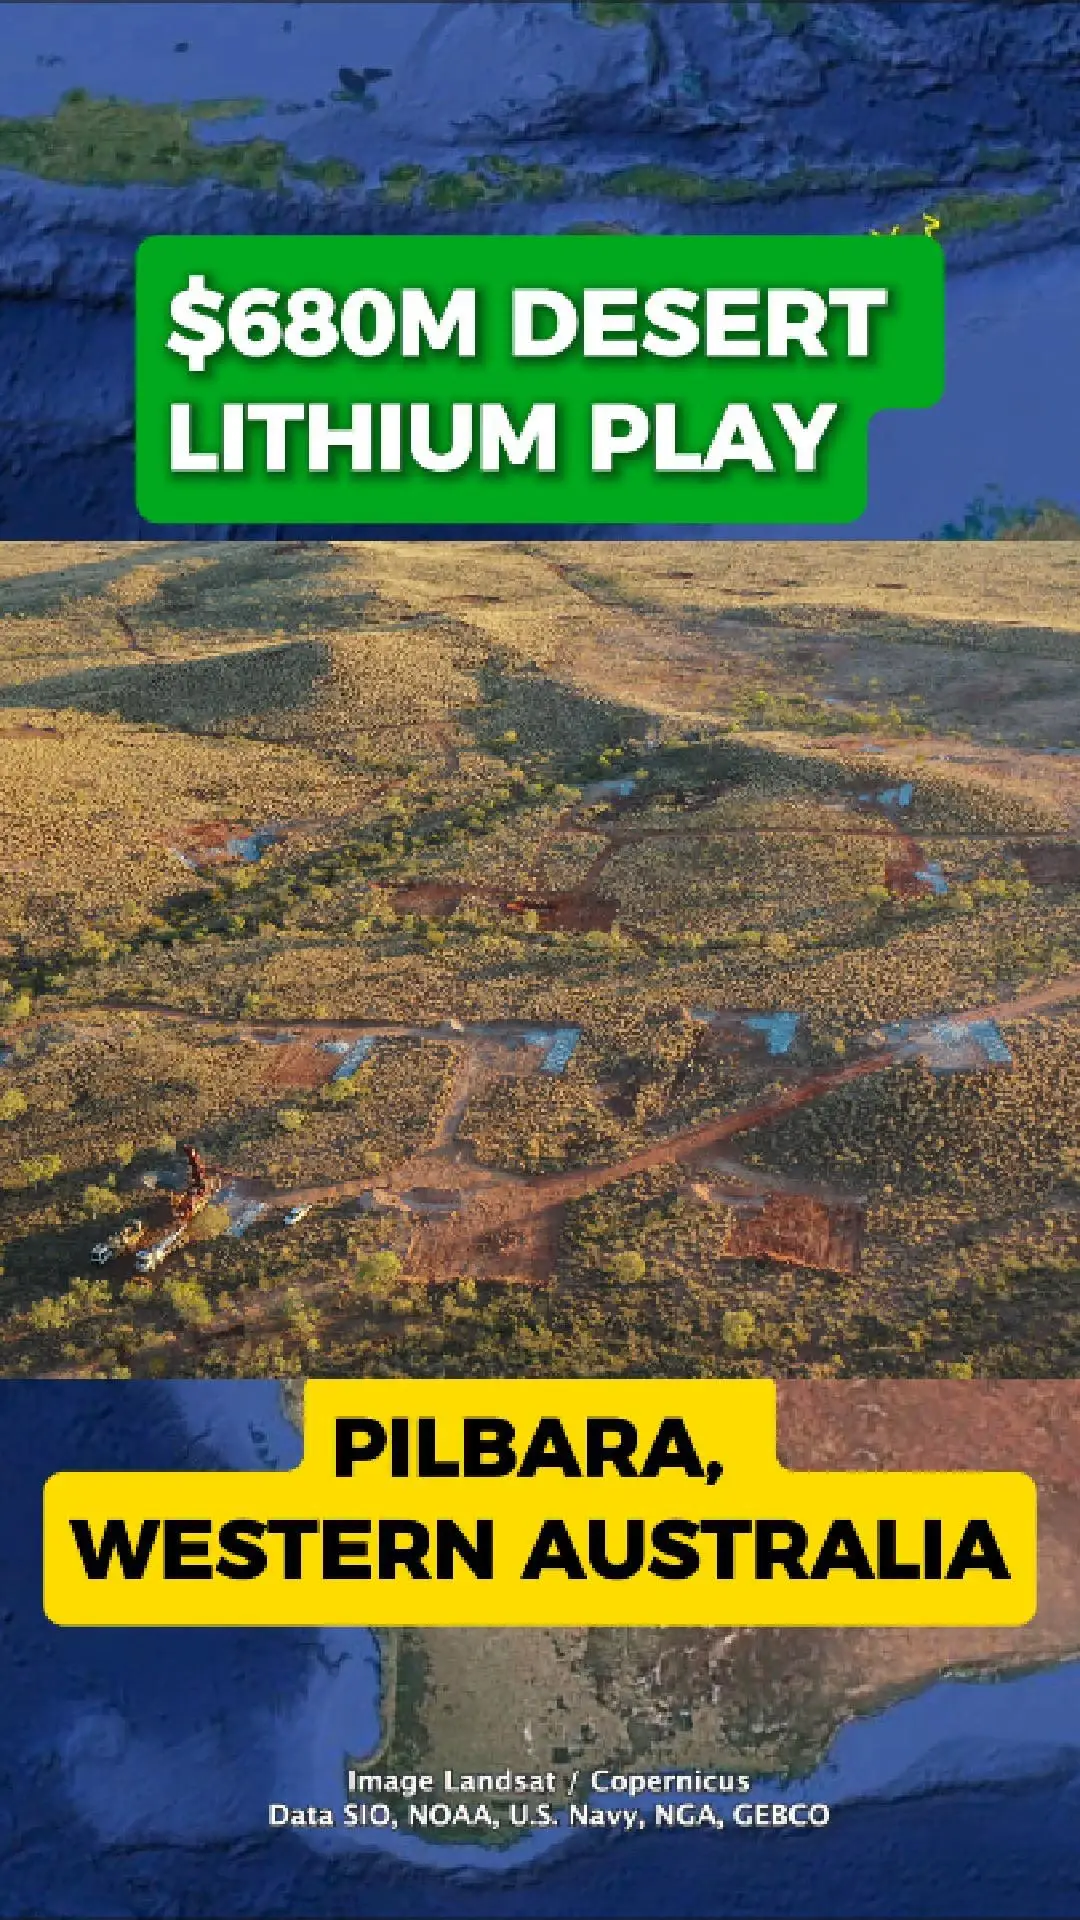
$680m Pilbara Lithium Push Takes Shape at Tabba Tabba
Just outside Port Hedland, in the heart of Western Australia’s Pilbara, Wildcat Resources is advancing its Tabba Tabba lithium play — a rapidly progressing project positioned in one of the world’s most active battery-minerals regions.
The project sits roughly 80 kilometres from port ...
Just outside Port Hedland, in the heart of Western Australia’s Pilbara, Wildcat Resources is advancing its Tabba Tabba lithium play — a rapidly progressing project positioned in one of the world’s most active battery-minerals regions.
The project sits roughly 80 kilometres from port ...
$IMA
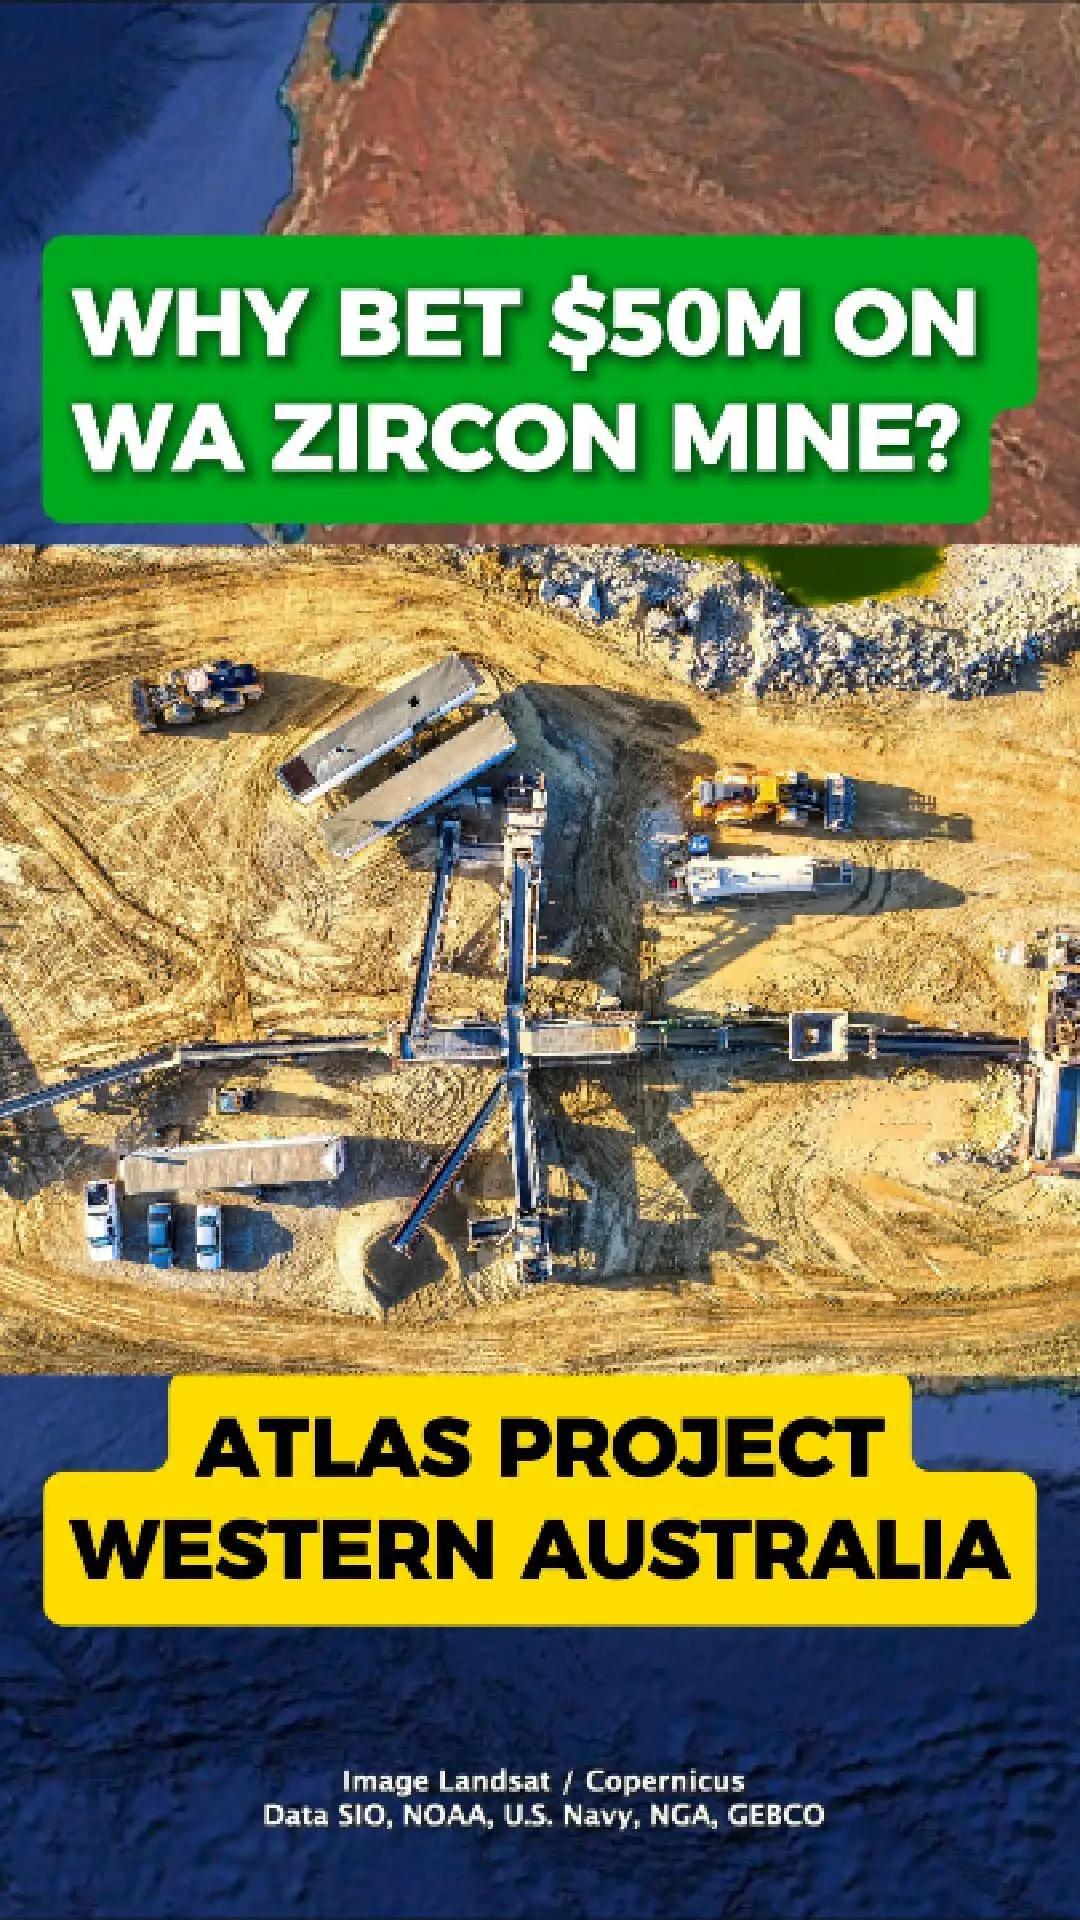
Why $50 million is being spent restarting a WA zircon mine
Image Resources has invested more than $50 million to bring its Atlas mineral sands project back into full production, around 180 kilometres north of Perth in Western Australia.
The Atlas project replaces the company’s earlier Boonanarring operation and began production in ...
Image Resources has invested more than $50 million to bring its Atlas mineral sands project back into full production, around 180 kilometres north of Perth in Western Australia.
The Atlas project replaces the company’s earlier Boonanarring operation and began production in ...
$HAS
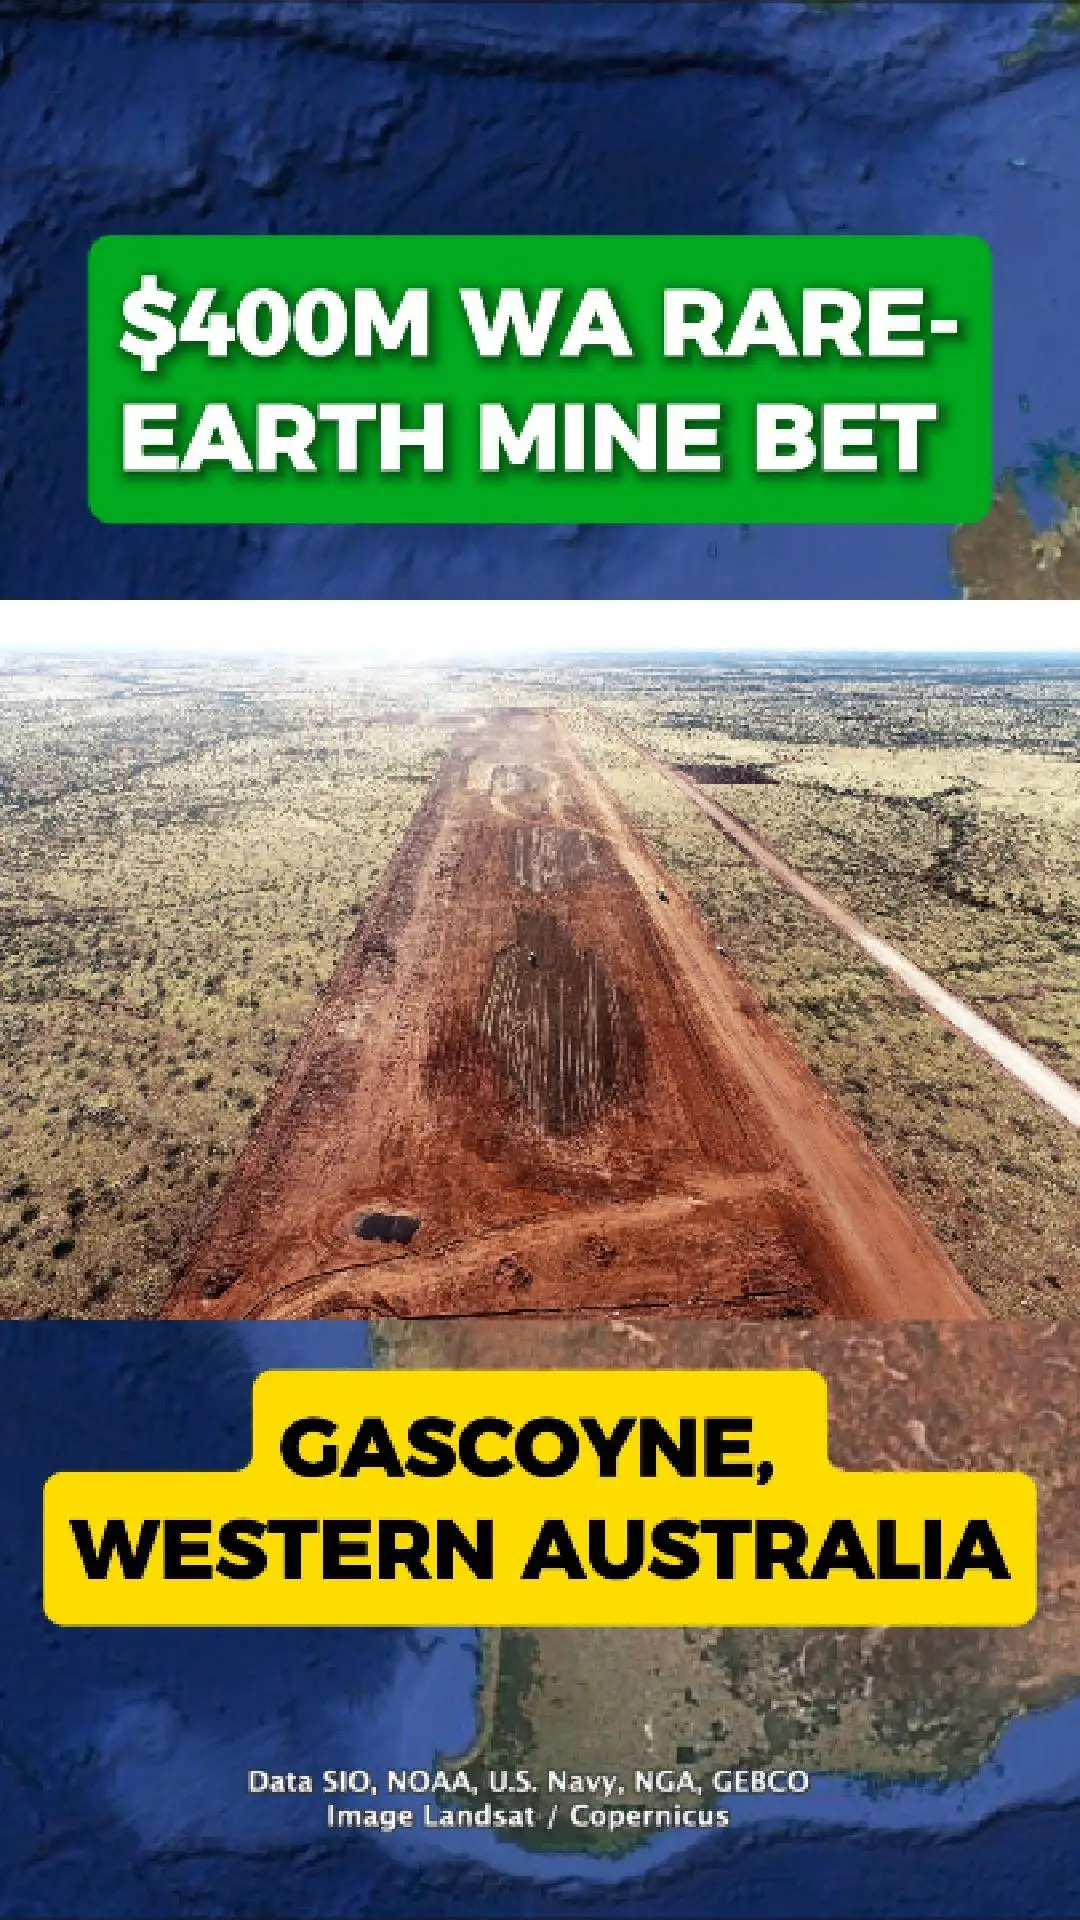
Why Spend Over $400M Building This WA Rare-Earth Mine?
Around 1,000 kilometres north of Perth, the Yangibana rare-earths project is aiming to become one of Australia’s key suppliers of neodymium and praseodymium (NdPr) — metals used in electric-vehicle motors, wind turbines and defence technology. The site sits in the Gascoyne region, ...
Around 1,000 kilometres north of Perth, the Yangibana rare-earths project is aiming to become one of Australia’s key suppliers of neodymium and praseodymium (NdPr) — metals used in electric-vehicle motors, wind turbines and defence technology. The site sits in the Gascoyne region, ...

Popular Stocks 🚀
Show more