Australia Fast-Tracks Major Niobium Discovery
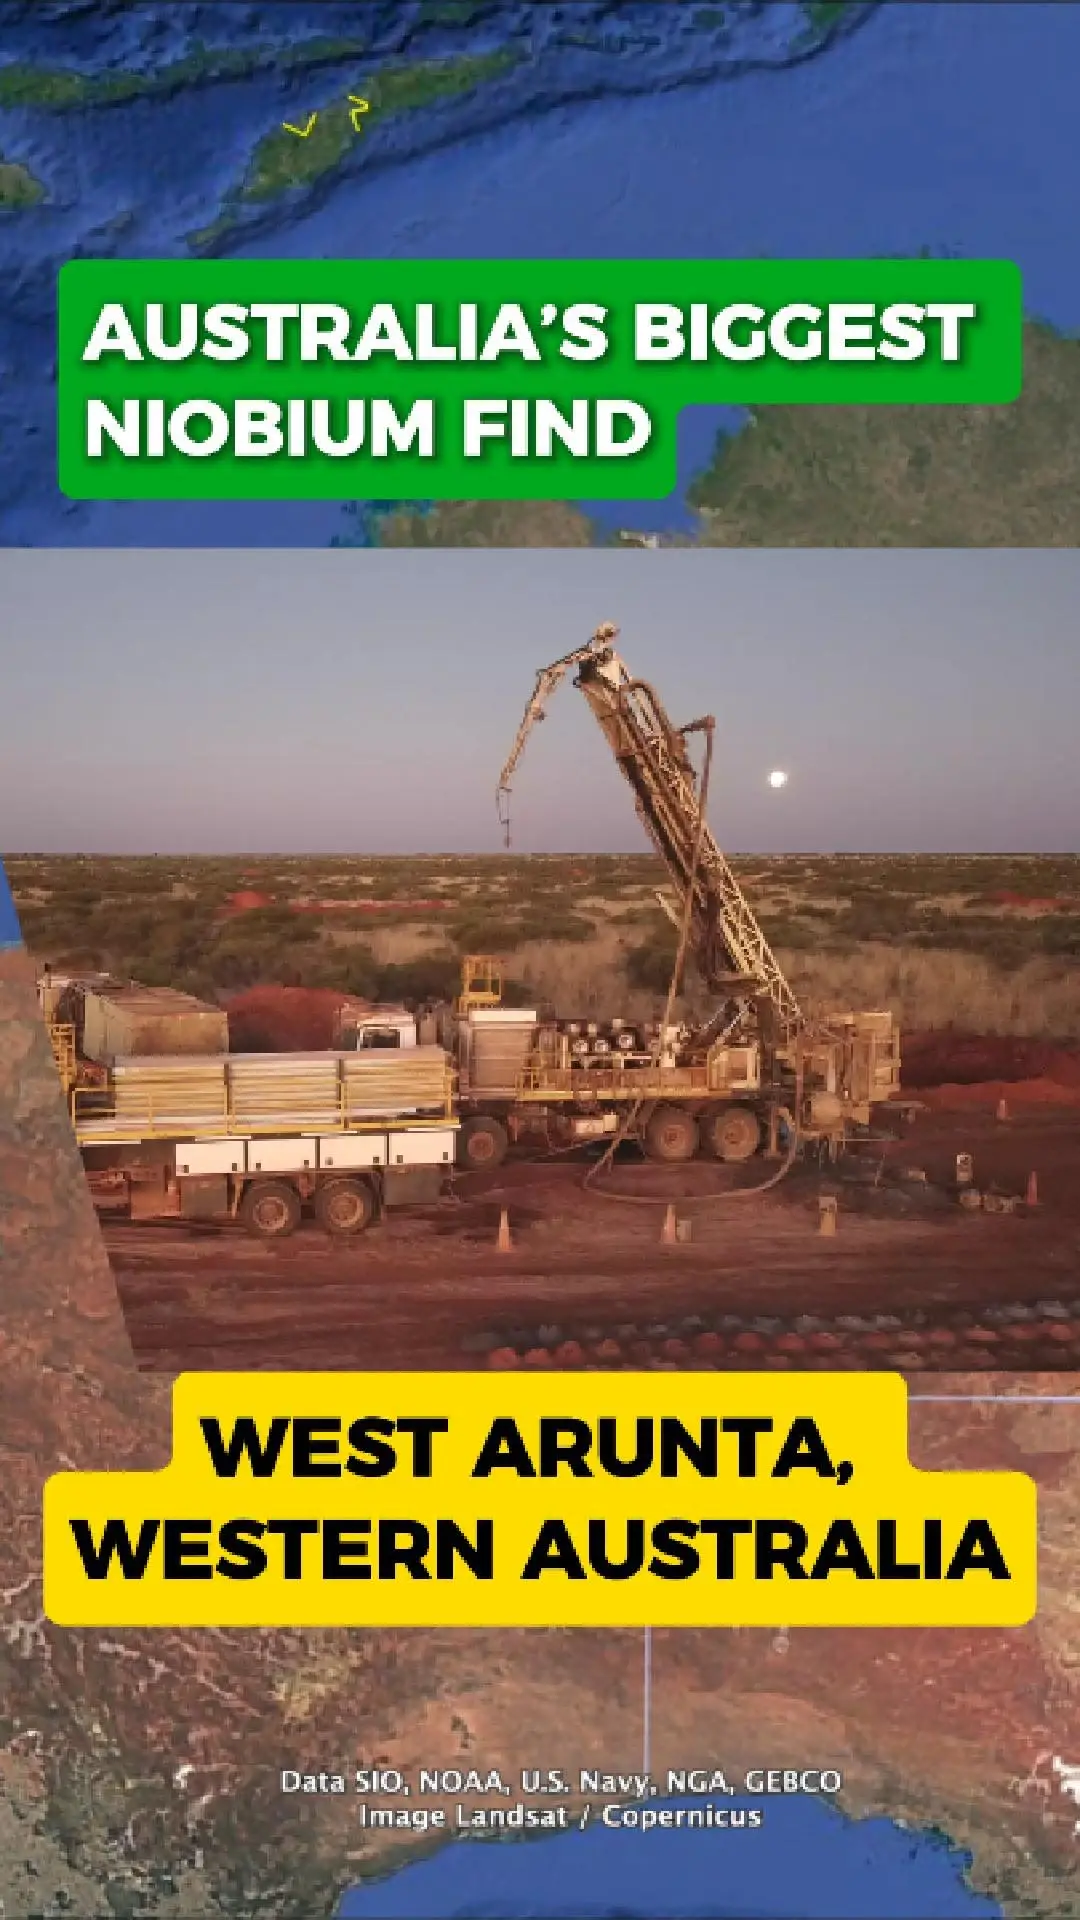
One Of The World’S Most Significant Niobium Discoveries Is Now Being Pushed Forward In Remote Western Australia, After The Federal Government Granted Major Project Status To Wa1 Resources’ Luni Project.
Located In The West Arunta Region, The Project Contains Over 200 Million Tonnes Of High-Grade Niobium- And Phosphorus-Rich Material — Described By Wa1 As The Biggest Niobium Discovery In 70 Years.
Why Niobium Matters
Niobium Is A Strategic Critical Mineral Used To Strengthen High-Performance Steel, Particularly In Pipelines, Automotive Components And Major Construction.
It Is Also Essential In Jet Engine Superalloys, Superconducting Magnets, Electronics, And Other Advanced Technologies.
The Scale Of Luni Gives Australia A Rare Opportunity To Expand Its Role In The Global Supply Of This Specialised Metal, Which Is Currently Dominated By Brazil.
A Key Step In Strengthening Supply Chains
The Major Project Status Designation Signals Canberra’S View Of Luni As A Development With National Economic And Strategic Importance.
Wa1 Says The Recognition Highlights Luni’S Potential To Support Regional Jobs, Bolster Sovereign Capability, And Contribute To Australia’S Growing Critical-Minerals Export Sector.
As Studies Progress, Luni Is Shaping Up As One Of The Country’S Most Important New Mineral Projects — And A Rare Moment Of Global Significance For The Niobium Industry.
 ASX:WA1