G Godolphin Resources Limited
ASX:GRL
Australia
5.6k
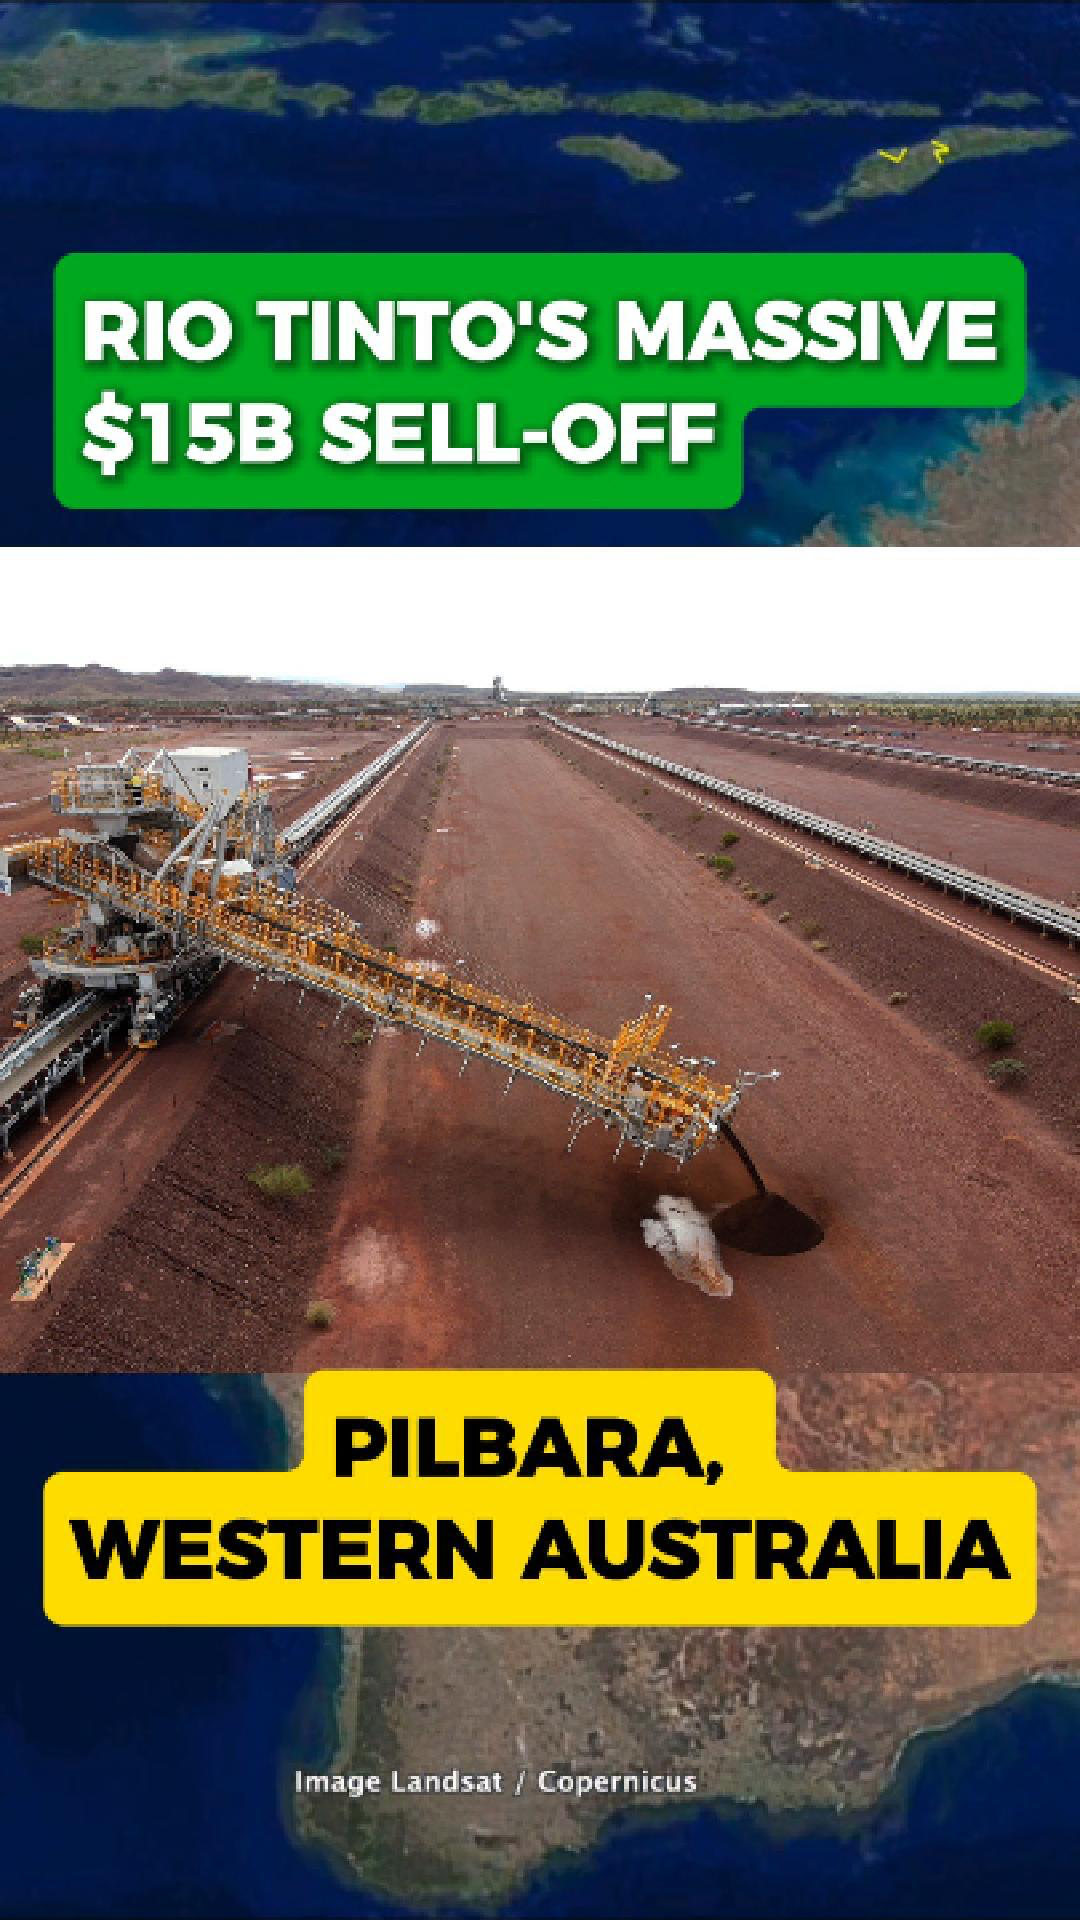
Rio Tinto Launches $15 Billion Asset Sell-Off
Rio Tinto Has Announced Plans To Sell Up To $15 Billion Worth Of Assets As Part Of A Strategy To Streamline The Company And Refocus On Its Core Operations. The Move Marks One Of The Largest Portfolio Resets In The Miner’S History.
Iron Ore Still The Backbone
At Tom Price In Western Australia’S Pilbara Region, Iron Ore Is Moved By Rail Almost 400 Kilometres To Cape Lambert, Where It Is Loaded Onto Ships Bound For Asia. These Pilbara Mines Remain Rio’S Strongest Earnings Driver And Will Not Be Part Of The Sell-Off.
What Will Be Sold?
Rio Plans To Offload Non-Core Mines, Land Parcels, And Parts Of Its Processing And Infrastructure Portfolio. The Company Is Also Reducing Spending On Decarbonisation Projects, Shifting Towards Third-Party Partnerships Instead Of Funding Major Energy Investments Itself.
Simandou Adds Global Pressure
The Timing Of The Reset Coincides With The Long-Awaited Ramp-Up Of The Simandou Iron Ore Project In Guinea, Which Will Introduce New Global Supply. The Added Competition Has Intensified Rio’S Push To Sharpen Its Business And Strengthen Financial Performance.
A High-Stakes Strategy
Rio Says The Changes Will Make The Company “Stronger, Sharper And Simpler.”
But With Iron Ore Markets Shifting And New Supply Emerging, The Key Question Remains: Will Selling Too Much Reduce Rio’S Long-Term Advantage?
 ASX:RIO
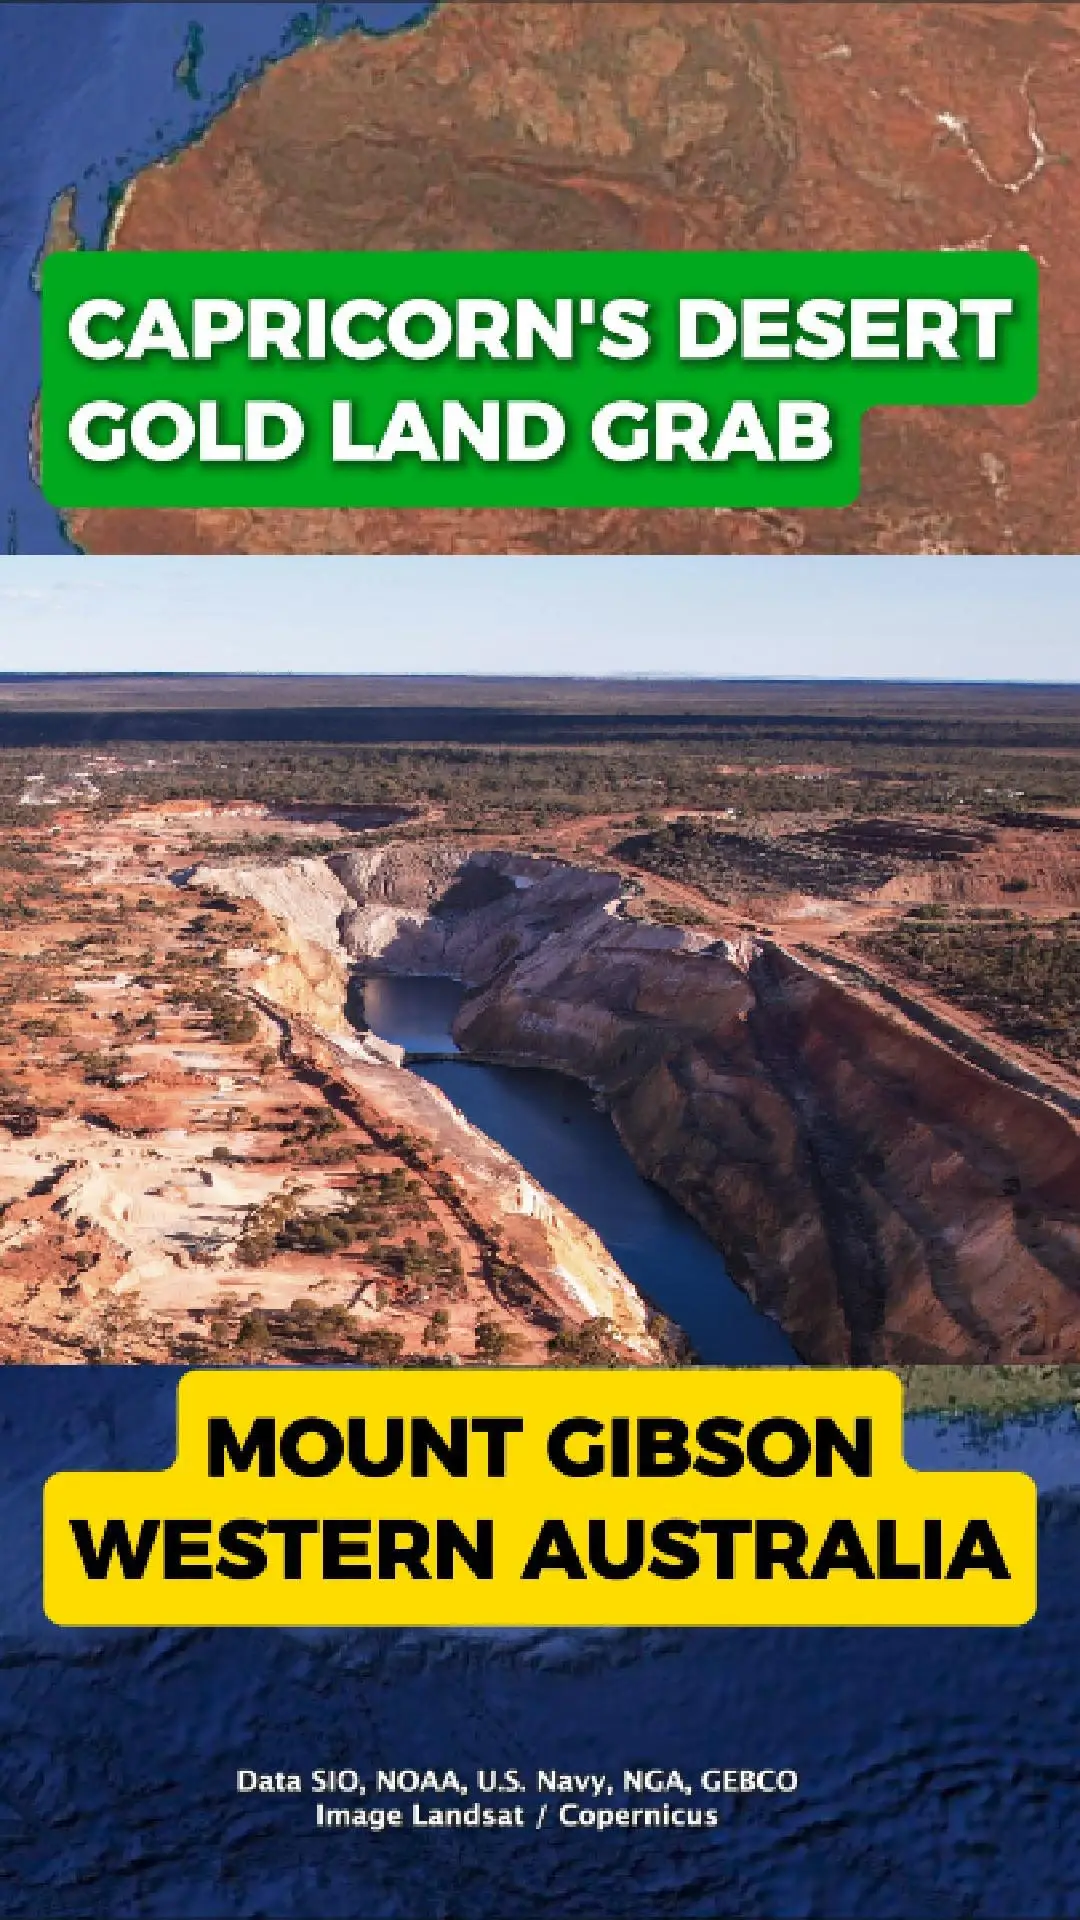
Capricorn Expands In Mount Gibson Gold District
Capricorn Metals Has Made A Low-Key Christmas Acquisition In Western Australia’S Mount Gibson Gold District, Strengthening Its Regional Footprint.
The Company Has Agreed To Buy The Nearby Yalgoo Project For $4.5 Million, Adding Around 1,000 Square Kilometres Of Prospective Ground To Its Existing Exploration Holdings.
Strengthening The Mount Gibson Footprint
The Yalgoo Project Sits Close To Capricorn’S Recently Acquired Golden Range And Fields Find Projects, Both Located Near The Mount Gibson Area. The Land Package Is Considered Prospective For Gold And Copper, With Scope For Future Discoveries.
Rather Than A Short-Term Production Move, The Acquisition Is Aimed At Long-Term Consolidation Across The District.
Focus On Future Ore Supply
Capricorn Has Positioned The Deal As A Strategic Step To Secure Potential Future Ore Sources, Supporting The Long-Term Outlook For Mining Operations In The Mount Gibson Region.
The Acquisition Reflects An End-Of-Year Strategy Focused On Locking Up Ground Early, While Exploration Activity Is Expected To Ramp Up In Future Years.
ASX:CMM
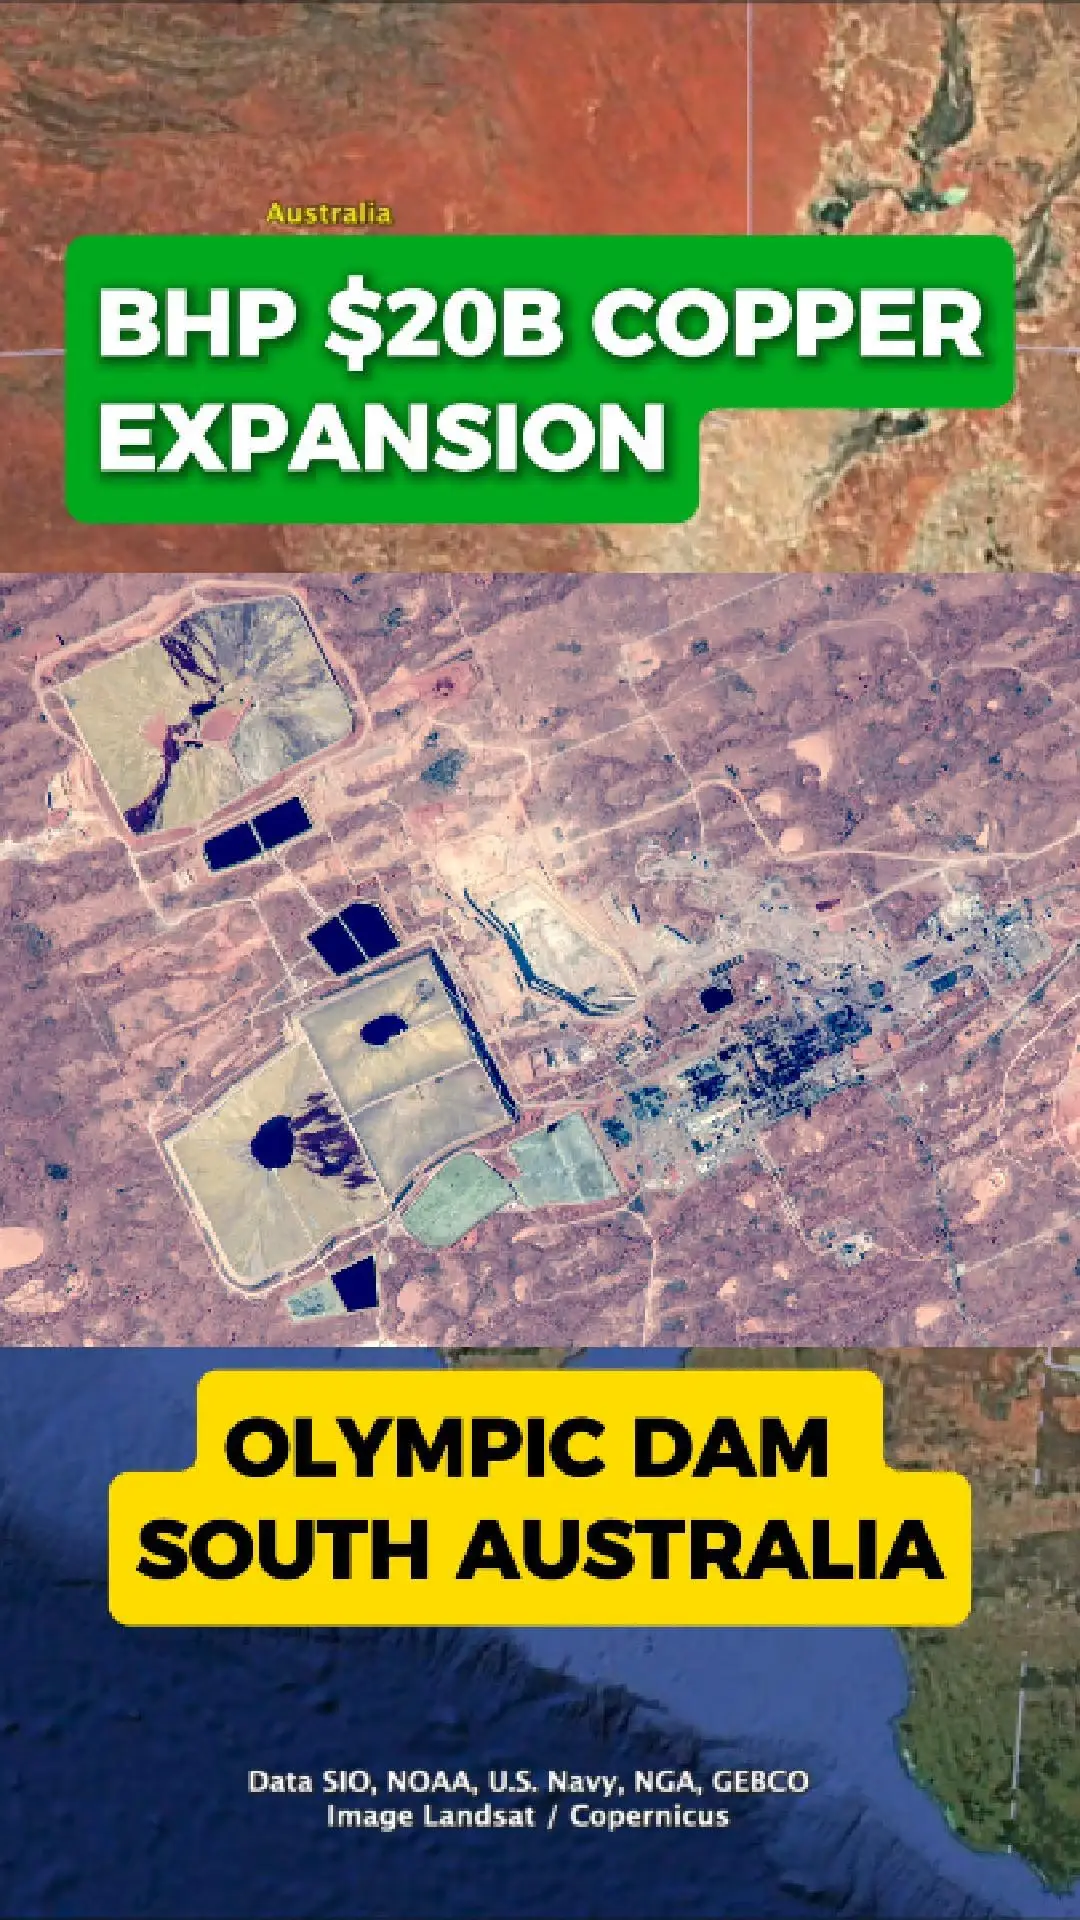
Bhp Weighs $20 Billion Copper Expansion In South Australia
Around 500 Kilometres North Of Adelaide Sits Olympic Dam, One Of The World’S Largest And Most Valuable Copper Deposits. It’S A Long-Running Operation In The Heart Of South Australia’S Outback, And A Critical Asset In Global Copper Supply.
Linking Olympic Dam With Oak Dam
Bhp’S Latest Studies Investigate Connecting Olympic Dam With Oak Dam — A High-Grade Copper Discovery Located Nearby. If Developed Together, The Two Sites Could Form A New Copper Hub Capable Of Lifting South Australia’S Production For Decades.
A Project Facing Big Challenges
Despite The Scale Of The Opportunity, Several Challenges Are Slowing Progress. Rising Energy Costs, Limited Water Availability, And Ongoing Infrastructure Constraints All Add Complexity To The Project. Water Supply In Particular Remains A Key Issue In The Region, With Any Major Expansion Likely Requiring New Pipelines Or Desalination Investment.
Could This Be Australia’S Next Pilbara?
If Bhp Overcomes These Hurdles, South Australia Could Become Home To A Copper Province On The Scale Of The Pilbara’S Iron Ore Industry. With Global Demand For Copper Surging, The Region’S Long-Term Potential Is Significant — But Turning It Into Australia’S Next Major Mining Hub Will Depend On Solving Today’S Bottlenecks.
ASX:BHP
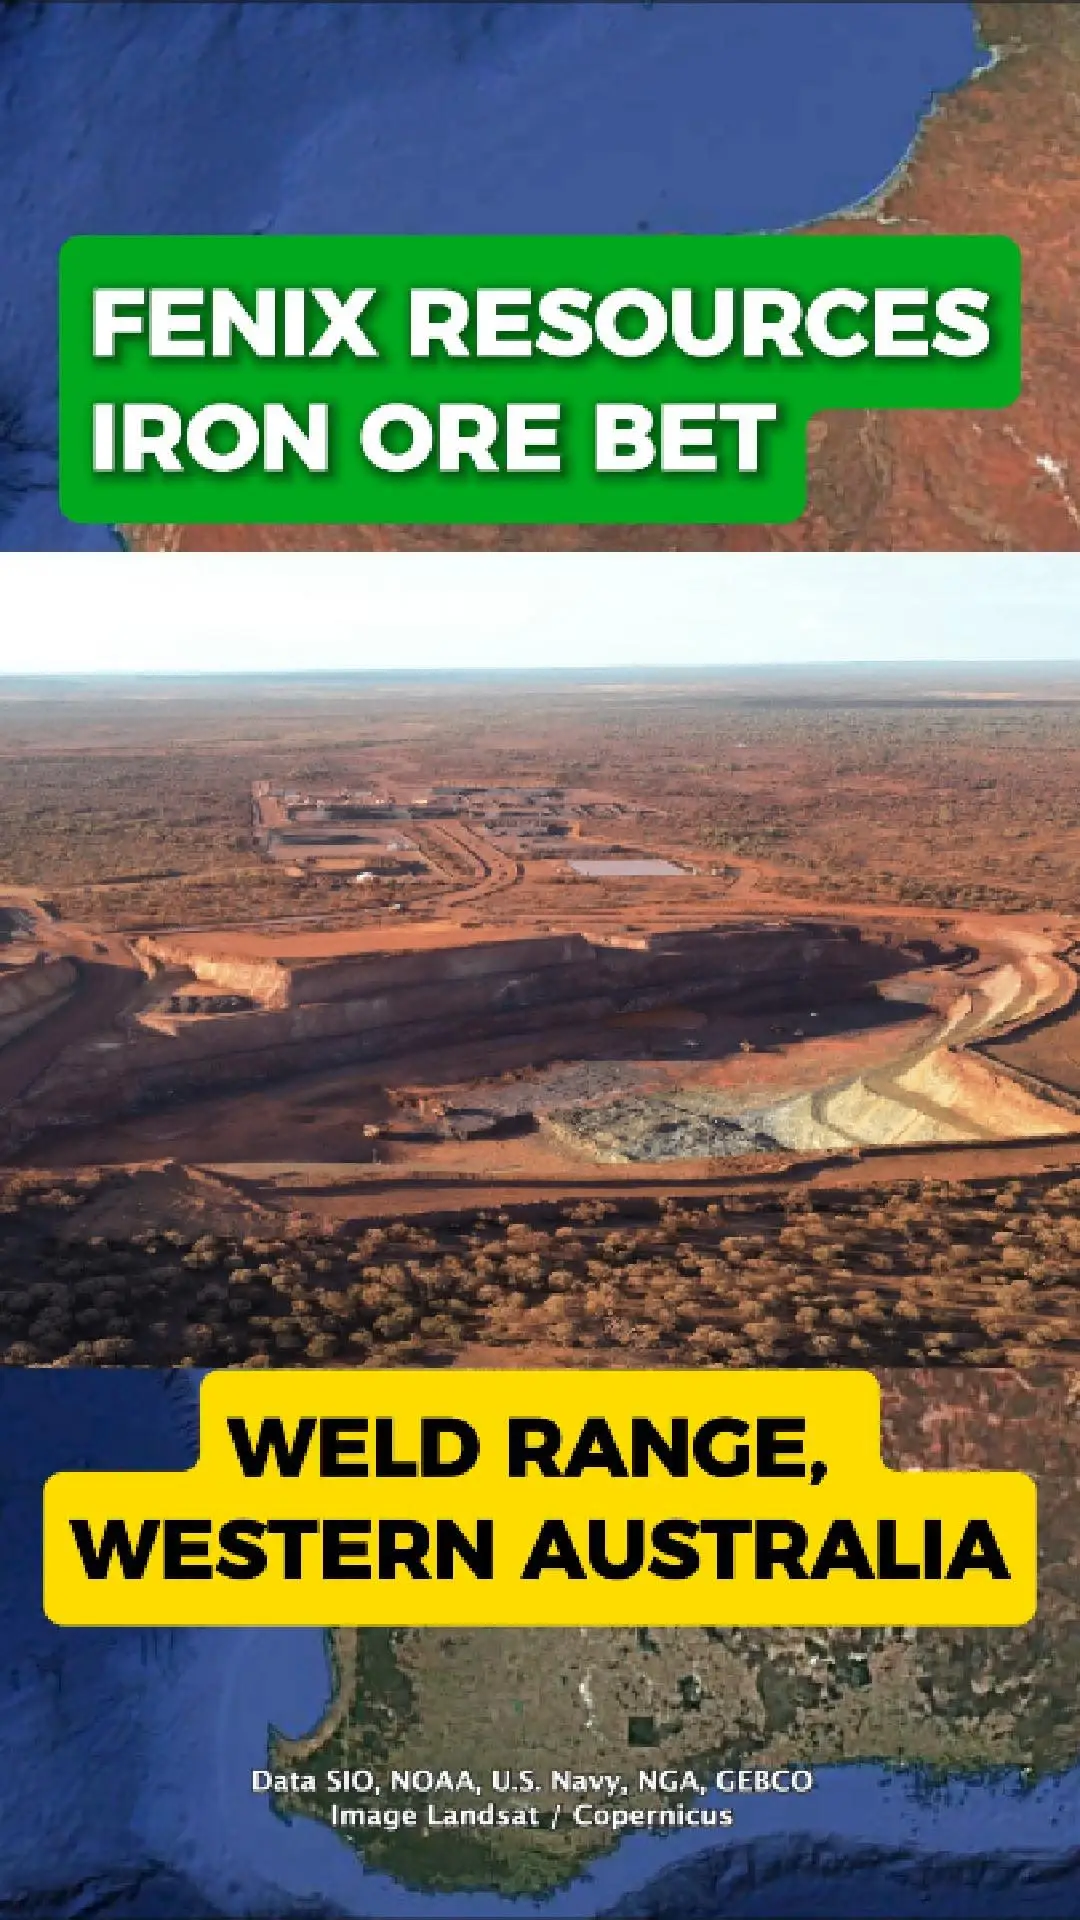
Fenix Shifts Iron Ore Focus To Weld Range
Every Year, Millions Of Tonnes Of Iron Ore Leave Western Australia’S Red Desert, Feeding Global Steel Markets. Now Fenix Resources Is Repositioning Its Iron Ore Operations, Placing The Weld Range At The Centre Of Its Future Production Plans.
As The Company’S Earlier Pits Begin To Wind Down, Fenix Is Moving Toward A More Centralised Approach Focused On Long-Term Stability And Scale.
From Multiple Pits To One Long-Life Hub
The Weld Range Offers Fenix A Long-Life Iron Ore Resource Supported By A 30-Year Mining Agreement. By Concentrating Operations In One Area, The Company Aims To Lift Output While Simplifying Its Production Footprint.
This Shift Marks A Move Away From Shorter-Life Pits Toward A More Sustained Operating Base.
Port Access Underpins The Strategy
A Key Advantage Of The Weld Range Is Its Access To Geraldton Port, Which Supports The Transport And Export Of Iron Ore From Wa’S Mid-West. This Connection Strengthens The Project’S Role In Fenix’S Broader Logistics And Export Strategy.
A Foundation For The Next Phase
With Its Focus Now Turning To The Weld Range, Fenix Is Positioning The Project As The Anchor Of Its Next Phase Of Iron Ore Production. The Strategy Reflects A Broader Push Toward Scale, Efficiency, And Long-Term Continuity.
Whether The Weld Range Becomes The Defining Chapter In Fenix’S Iron Ore Story Will Unfold As The Transition Progresses.
ASX:FEX
Popular Stocks 🚀
Show more