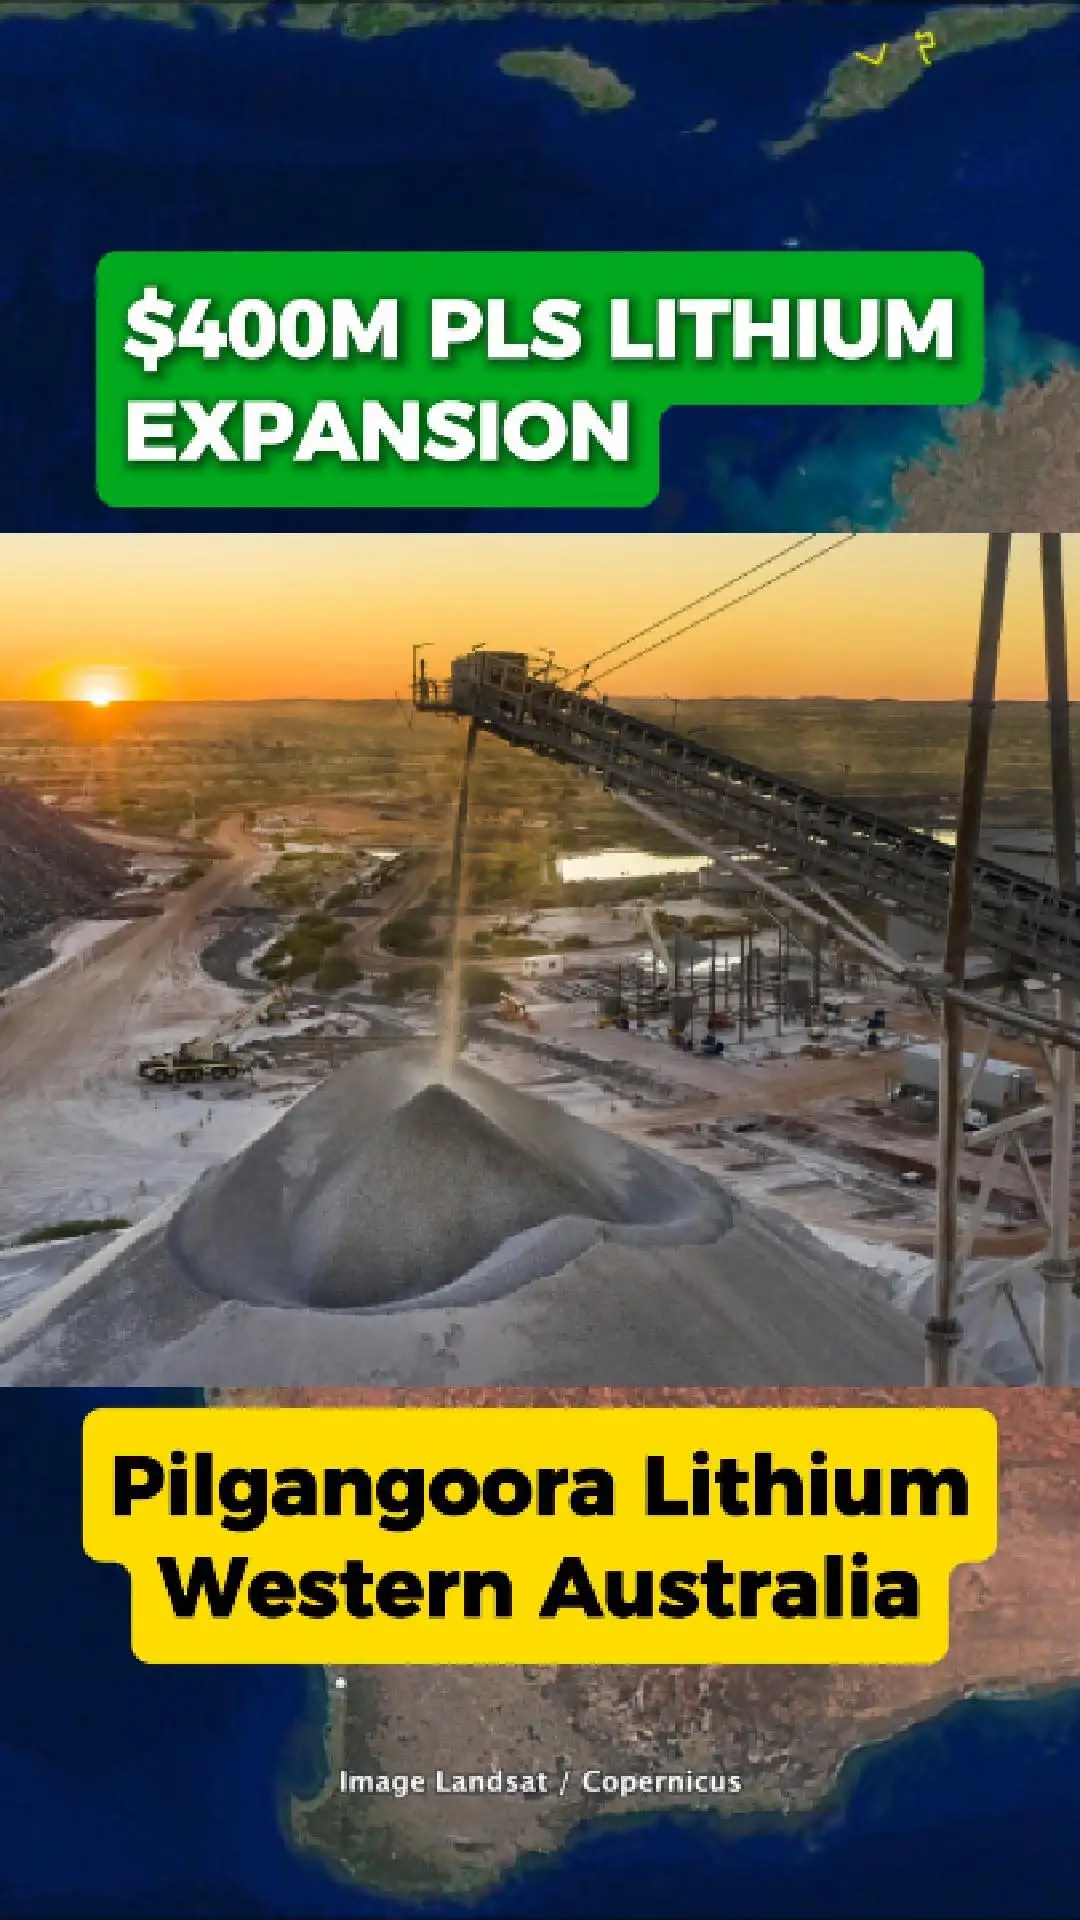
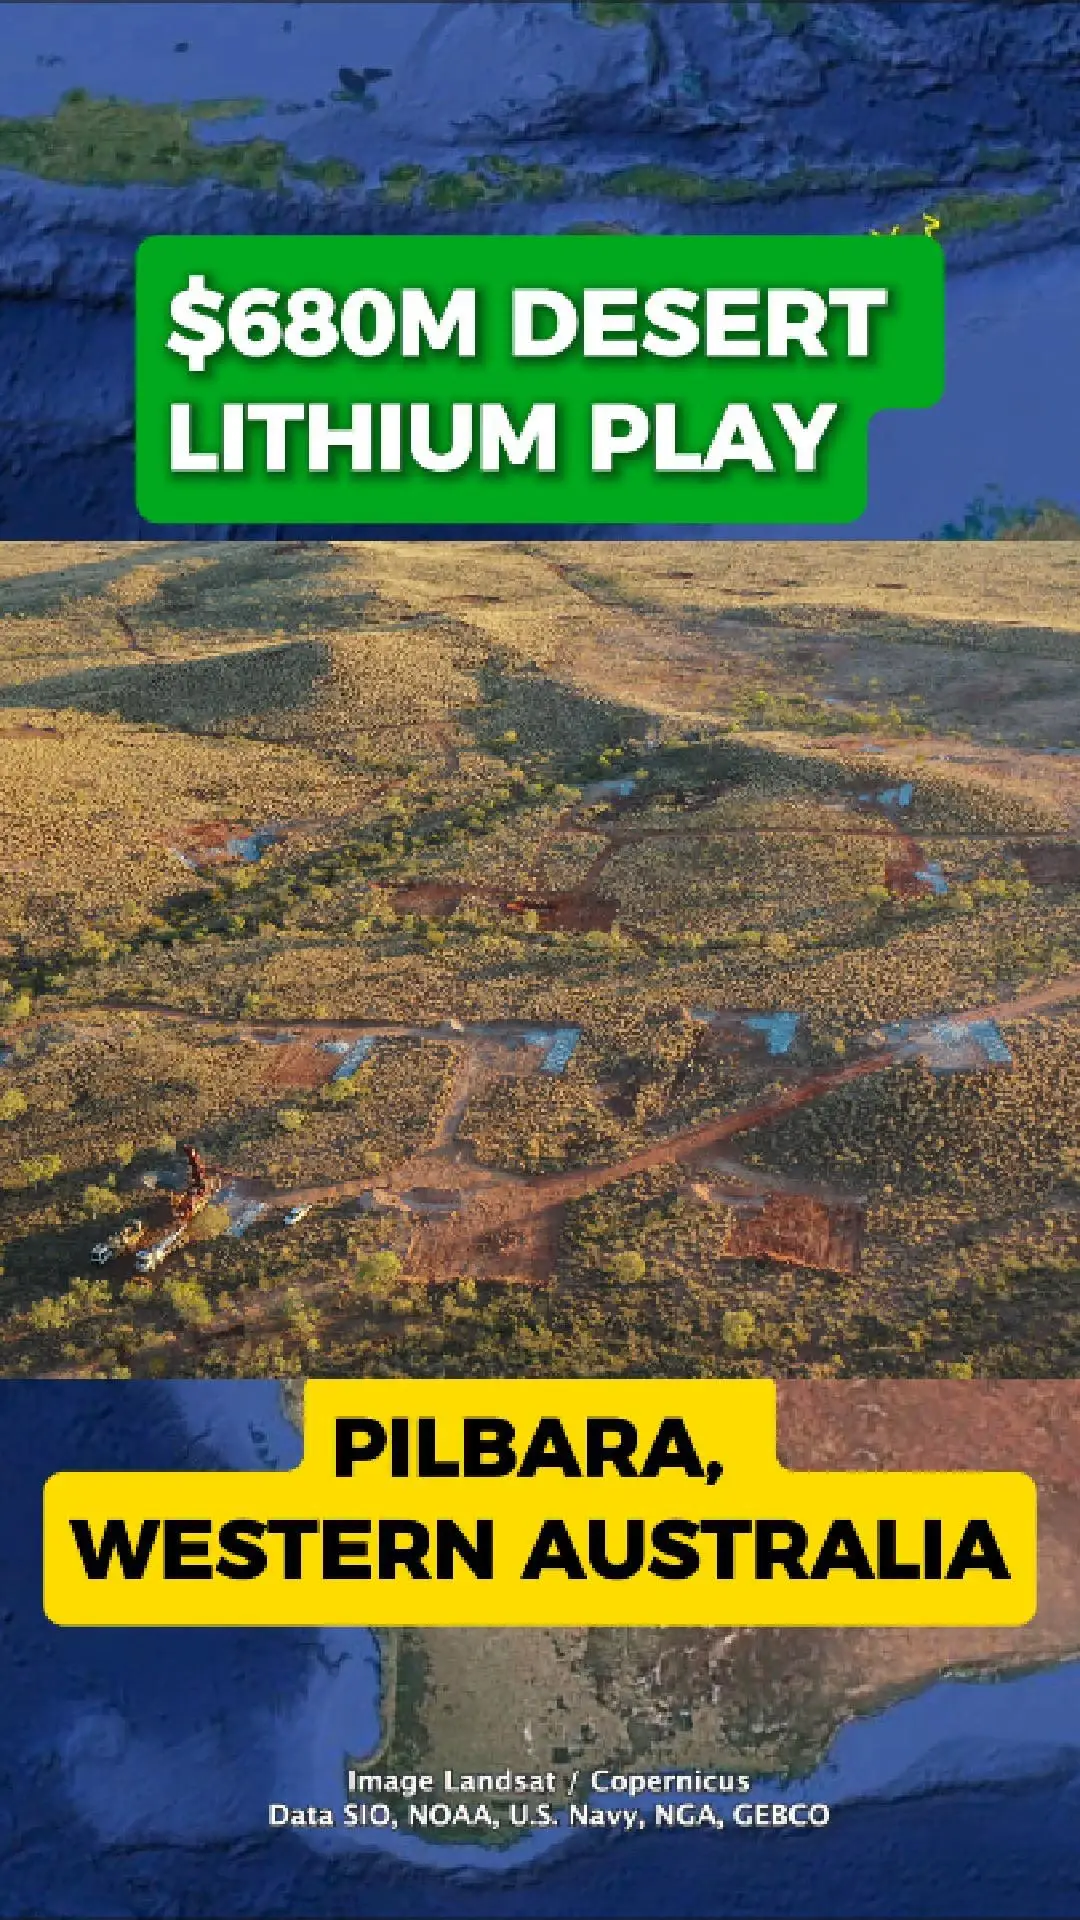
📈 RSI: 46% – ⚪ Neutral – No strong directional bias — consolidation or indecision in the market. RSI measures the speed and size of price moves to gauge momentum. Best used alongside MACD or volume to confirm signals.
📉 MACD Summary
MACD Percentile: 59% – ⚪ MACD is in the middle range — neutral positioning relative to the past year.
Momentum Strength: -0.010 – 🟠 Mild Bearish Crossover – MACD just dipped under signal. Weakening short-term momentum.
📊 ADX: 19.8 – 🟠 Weak Trend – Some early momentum, but not fully confirmed. May stay range-bound. ADX measures *trend strength*, not direction. Combine with MACD or moving averages to confirm trend direction and trade signals.
🔊 Volume: 2,781,559 – 🟡 Light – Lower volume than normal — move may lack conviction. Volume shows trading activity. High volume confirms trends or news, while low volume may suggest weak follow-through. Often used with RSI and MACD.
📉 Short Interest: 6.93% – 🟠 Moderate – Noticeable short positioning — cautious sentiment, may impact price moves. Short interest shows how many traders are betting a stock will fall. Higher values suggest bearish outlook, but also raise short squeeze potential.
💰 Yield: 5.00% – 🟢 High Yield – Strong income potential — often favored by dividend investors. Dividend yield shows the income return relative to share price. Use alongside payout ratio and earnings to assess sustainability.
Price Trend:
⏸️ Slowing Strength — Both timeframes show growth, but recent gains are moderating. Momentum may be tapering off.
🧯 Momentum Divergence – Trend and momentum disagree, possibly a turning point.
📏 Z-Score: +1.66 – 🟠 Slightly Above Avg – Stock is trading at a modest premium — may reflect optimism or momentum. Z-Score shows how far price deviates from its seasonal mean. Useful for spotting extreme overbought or oversold levels over time.
📅 This Month: 75% Consistently Up 📊 Avg Return: 14.84% | 📈 Current Return: -1.05% 🟢 Reasonable Edge – Solid past performance.
📅 Next Month: 38% Consistently Up 📊 Avg Return: -0.15% 🟠 Often Weak – More losses than gains.
*These charts and explainers are for educational and informational purposes only. This is not financial advice. Company data is sourced from public APIs and may not be 100% accurate — it's intended as a general overview only.*
📈 RSI: 46% – ⚪ Neutral – No strong directional bias — consolidation or indecision in the market. RSI measures the speed and size of price moves to gauge momentum. Best used alongside MACD or volume to confirm signals.
📉 MACD Summary
MACD Percentile: 59% – ⚪ MACD is in the middle range — neutral positioning relative to the past year.
Momentum Strength: -0.010 – 🟠 Mild Bearish Crossover – MACD just dipped under signal. Weakening short-term momentum.
📊 ADX: 19.8 – 🟠 Weak Trend – Some early momentum, but not fully confirmed. May stay range-bound. ADX measures *trend strength*, not direction. Combine with MACD or moving averages to confirm trend direction and trade signals.
🔊 Volume: 2,781,559 – 🟡 Light – Lower volume than normal — move may lack conviction. Volume shows trading activity. High volume confirms trends or news, while low volume may suggest weak follow-through. Often used with RSI and MACD.
Price Trend: ⏸️ Slowing Strength — Both timeframes show growth, but recent gains are moderating. Momentum may be tapering off.
🧯 Momentum Divergence – Trend and momentum disagree, possibly a turning point.
Coles to replace warehouse workers with an automated warehouse. - Well I for one welcome our new AI overlords. In all seriousness, interest rates won’t be the only thing increasing the unemployment rate up.