ASX:LRV
— ASX Mining News & Discussion | LARVOTTO RESOURCES LIMITED
L
Larvotto Resources Limited
$LRV
Larvotto Resources’ Clarks Gully prospect continues to deliver for its Hillgrove antimony-gold project
(www.australianmining.com.au/standout-in…)
$LRV
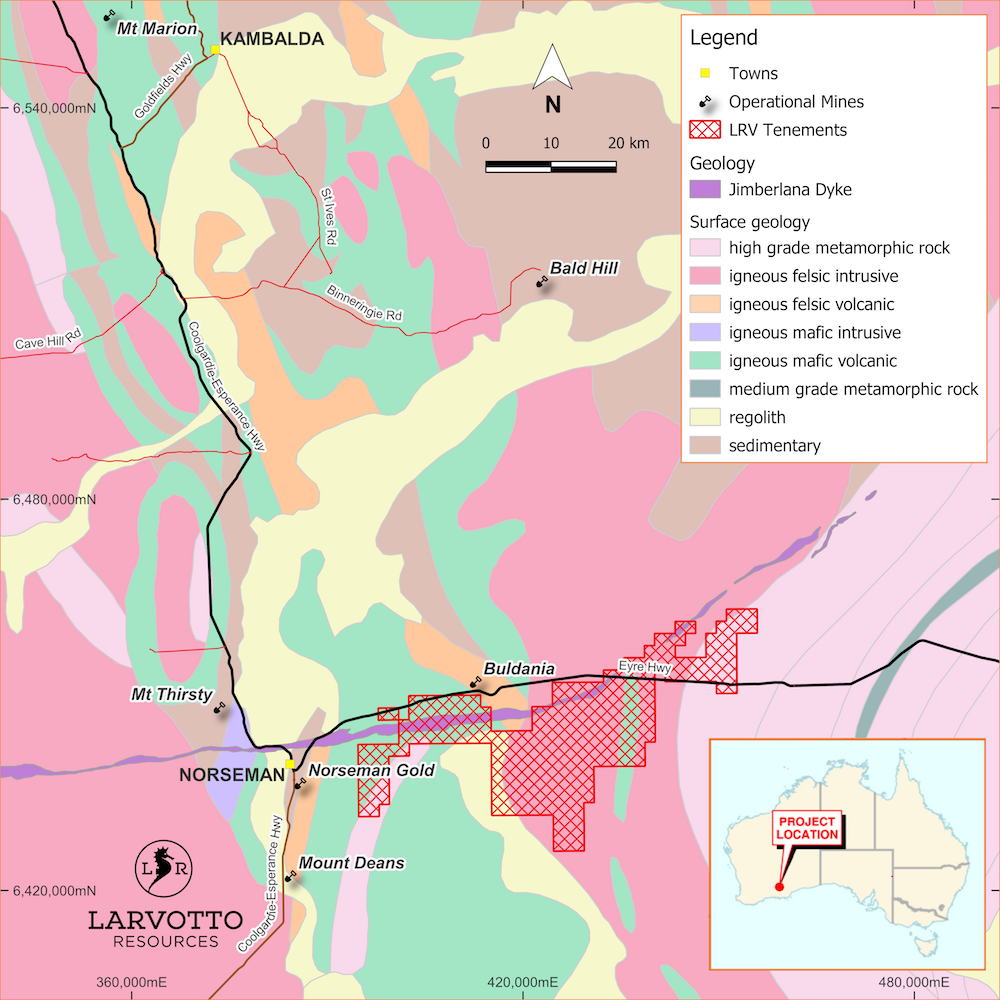
Larvotto Resources Commences Lithium, Nickel and Platinum Drilling Program at Eyre Project
Loading more...