L Lynas Rare Earths Limited
ASX:LYC
Australia
668
Who Is Amanda Lacaze? Chief Executive Officer Of Lynas Rare Earths
 ASX:LYC

What Are The Potential Scenarios Between Lynas Rare Earths And Mp Materials?
ASX:LYC
Who Is The Team Behind The Success Of Lynas Rare Earths?
ASX:LYC

Milestone Achieved: Lynas Rare Earths' Kalgoorlie Facility Marks Historic First Feed On"
ASX:LYC
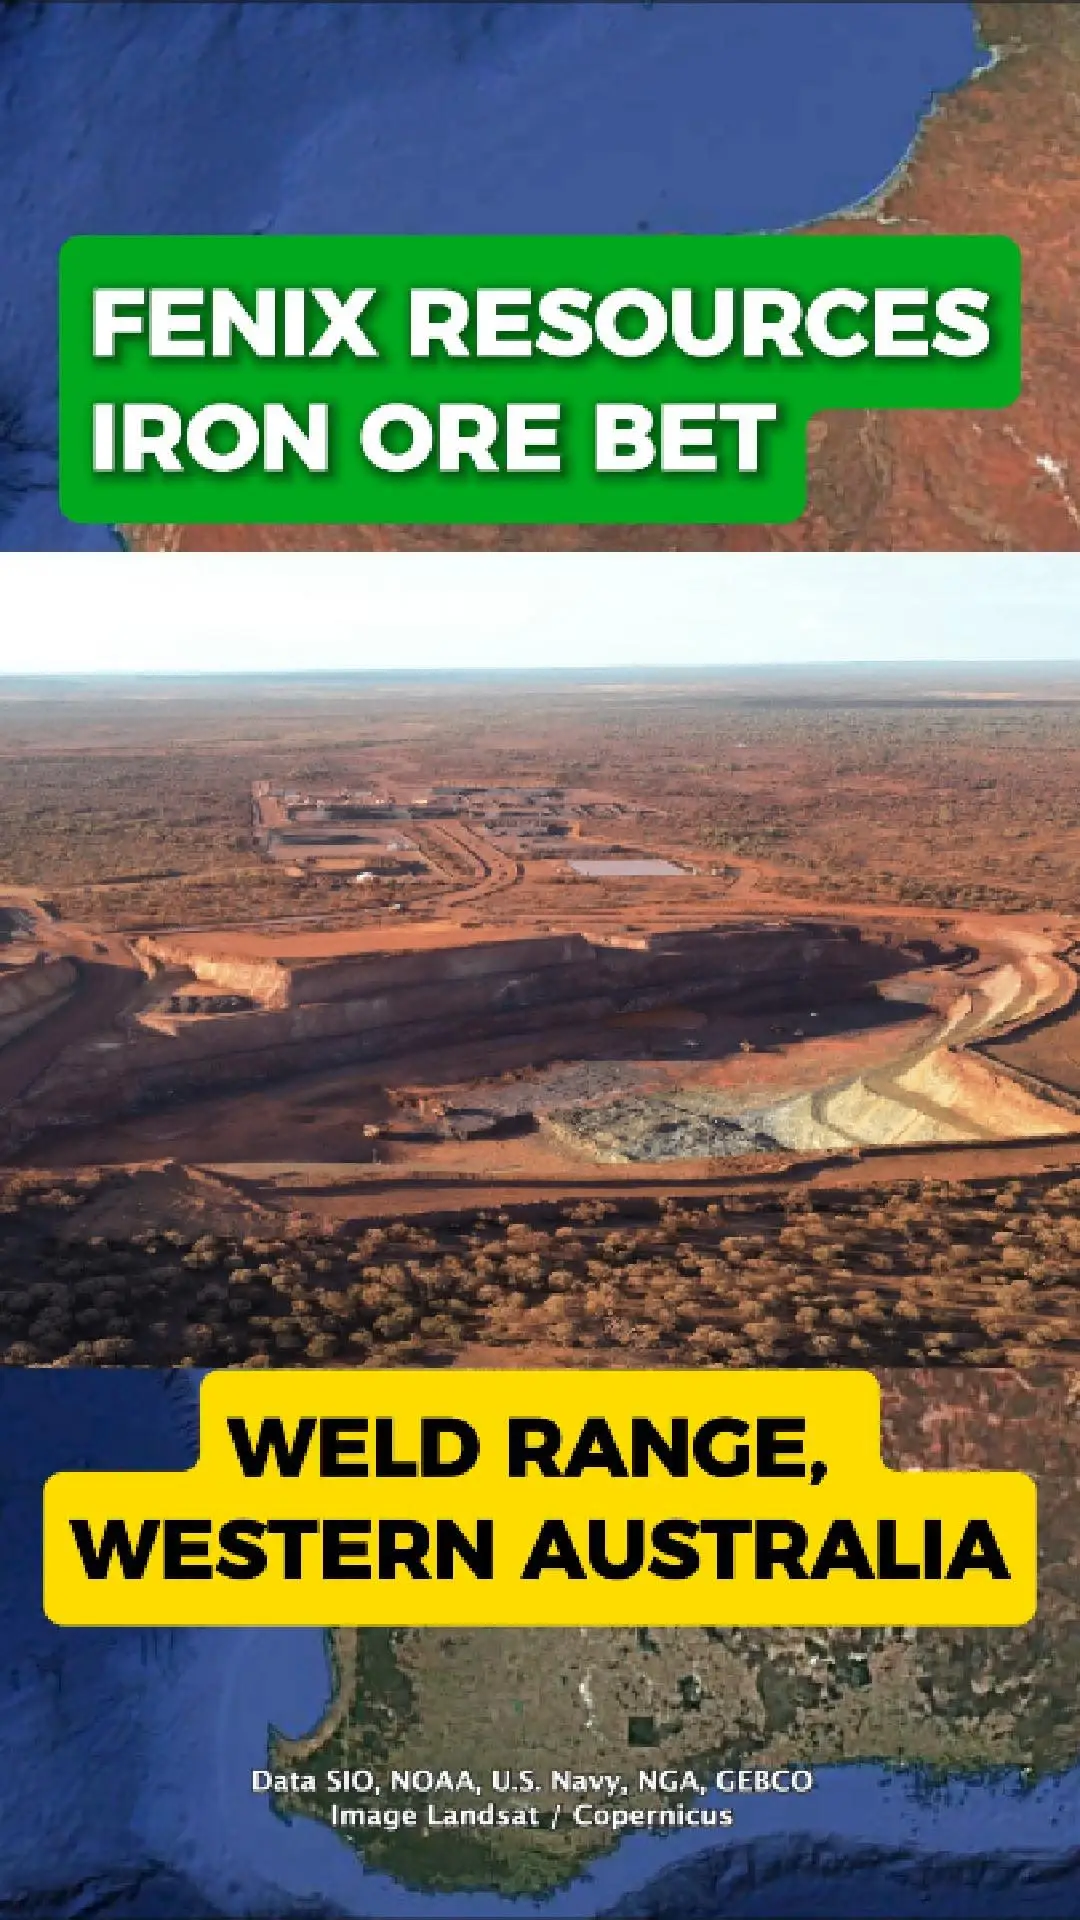
Fenix Shifts Iron Ore Focus To Weld Range
Every Year, Millions Of Tonnes Of Iron Ore Leave Western Australia’S Red Desert, Feeding Global Steel Markets. Now Fenix Resources Is Repositioning Its Iron Ore Operations, Placing The Weld Range At The Centre Of Its Future Production Plans.
As The Company’S Earlier Pits Begin To Wind Down, Fenix Is Moving Toward A More Centralised Approach Focused On Long-Term Stability And Scale.
From Multiple Pits To One Long-Life Hub
The Weld Range Offers Fenix A Long-Life Iron Ore Resource Supported By A 30-Year Mining Agreement. By Concentrating Operations In One Area, The Company Aims To Lift Output While Simplifying Its Production Footprint.
This Shift Marks A Move Away From Shorter-Life Pits Toward A More Sustained Operating Base.
Port Access Underpins The Strategy
A Key Advantage Of The Weld Range Is Its Access To Geraldton Port, Which Supports The Transport And Export Of Iron Ore From Wa’S Mid-West. This Connection Strengthens The Project’S Role In Fenix’S Broader Logistics And Export Strategy.
A Foundation For The Next Phase
With Its Focus Now Turning To The Weld Range, Fenix Is Positioning The Project As The Anchor Of Its Next Phase Of Iron Ore Production. The Strategy Reflects A Broader Push Toward Scale, Efficiency, And Long-Term Continuity.
Whether The Weld Range Becomes The Defining Chapter In Fenix’S Iron Ore Story Will Unfold As The Transition Progresses.
ASX:FEX
Popular Stocks 🚀
Show more