
M Metals Acquisition
ASX:MAC
Website
Raise: $300m
Price: $16.00
Date: 20 Feb 2024

Bc8’S $36m Paulsens Gold Mine Restart: Is The Gamble Paying Off?
Black Cat Syndicate (Asx:Bc8) Committed $36 Million To Restart The Historic Paulsens Gold Mine In Western Australia’S Pilbara Region. The Company’S 2024 Restart Study Pointed To Strong Grades, Improved Mining Plans, And The Potential For A Major Lift In Operating Cashflow.
First Gold Arrives Ahead Of Schedule
By December 2024, Paulsens Had Already Poured Its First Gold Under Black Cat’S Ownership. This Marked A Major Milestone For A Mine That Had Previously Been On Care And Maintenance. Early Production Results Aligned With Expectations And Helped Build Momentum Into 2025.
Drilling Strengthens The Case
Through 2025, Drilling Across The Project Continued To Return Positive Results. New Intercepts Supported Extensions To Known Lodes And Reinforced The Company’S Belief In The Long-Term Potential Of The Paulsens System.
Gold Prices Provide A Tailwind
The Restart Has Come At A Time Of Strong Gold Prices, Giving Black Cat A Favourable Market Backdrop. Higher Margins And Stronger Cashflow Potential Have Helped Make The Restart More Compelling.
New Ground And Ore Deals Add Scale
In Addition To Mine Performance, Black Cat Secured New Exploration Ground And Ore-Supply Agreements With Dreadnought Resources. These Deals Give Paulsens Additional Feed Flexibility And Strengthen The Project’S Growth Pathway.
Is The $36m Gamble Working?
Early Signs Suggest The Restart Is Tracking Well: Gold Poured, Positive Drilling, Growing Production, And Supportive Market Conditions. While It’S Still Early In The Mine’S New Life, The Combination Of Grade, Scale, And Partnerships Indicates The Paulsens Comeback May Only Just Be Beginning.
 ASX:BC8
Poll

Minres Expands Onslow Iron With $3.5b Build
Ken’S Bore Mine Near Onslow Was Once Empty Red Desert. Today, It Sits At The Centre Of One Of Australia’S Largest New Iron-Ore Developments, As Mineral Resources Continues To Scale Up Its Onslow Iron Project In Western Australia.
New Mines, Port And Haul Road
Minres Is Expanding The Onslow Iron Hub With New Mining Areas, A Deep-Water Port And A 150-Kilometre Auto-Haul Road Designed For Autonomous Road Trains. The Infrastructure Forms Part Of A $3.5 Billion Investment Aimed At Building A Large, Long-Life Iron-Ore Operation With Efficient Logistics.
Focus On Cost And Scale
The Project Has Been Designed With Cost Control In Mind. Minres Has Previously Sold A Stake In The Haul Road Infrastructure To Reduce Capital Requirements While Keeping Access To The Critical Transport Corridor.
Competing In A Changing Market
As New Iron-Ore Supply Comes Online Globally, Including From Major Projects In Africa, Minres Is Positioning Onslow Iron To Compete On Cost And Reliability. The Success Of The Project Will Depend On Whether Its Scale And Infrastructure Can Deliver The Low-Cost Edge The Company Is Building Toward.
ASX:MIN
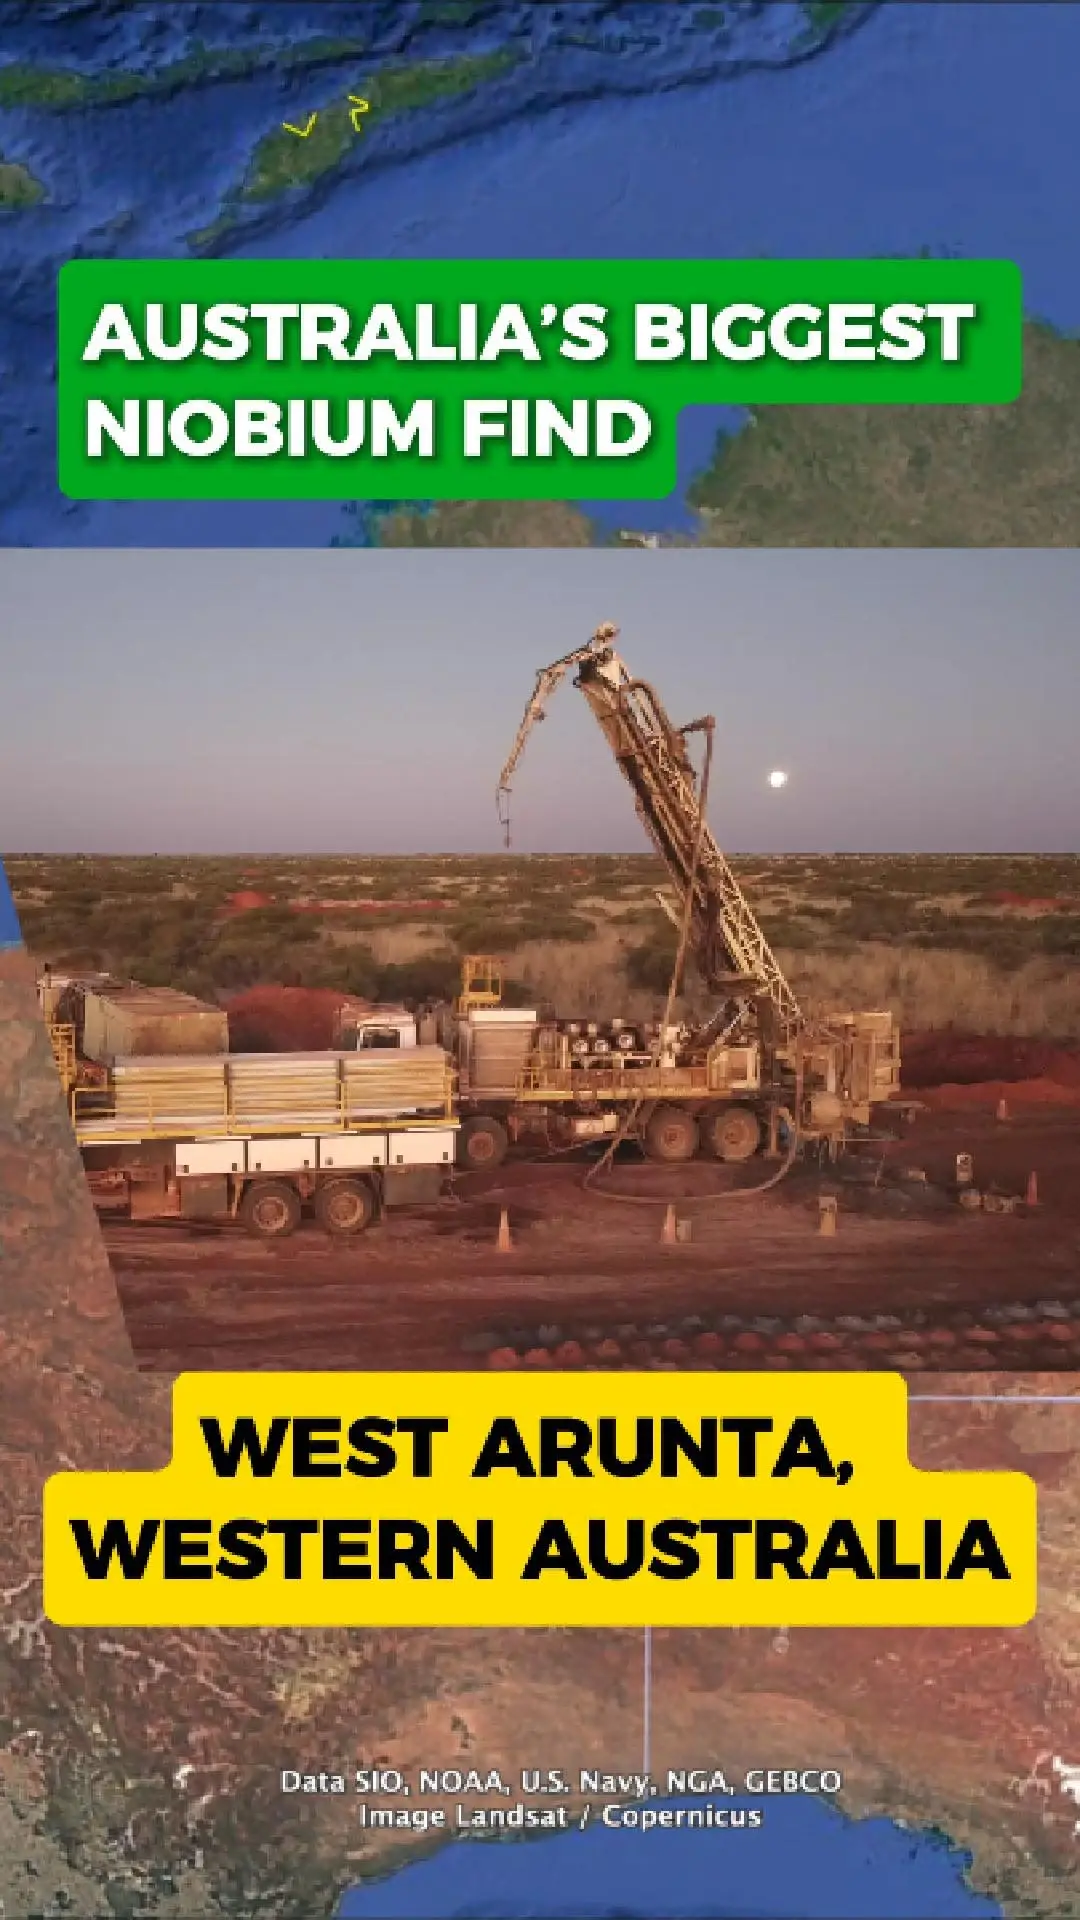
Australia Fast-Tracks Major Niobium Discovery
One Of The World’S Most Significant Niobium Discoveries Is Now Being Pushed Forward In Remote Western Australia, After The Federal Government Granted Major Project Status To Wa1 Resources’ Luni Project.
Located In The West Arunta Region, The Project Contains Over 200 Million Tonnes Of High-Grade Niobium- And Phosphorus-Rich Material — Described By Wa1 As The Biggest Niobium Discovery In 70 Years.
Why Niobium Matters
Niobium Is A Strategic Critical Mineral Used To Strengthen High-Performance Steel, Particularly In Pipelines, Automotive Components And Major Construction.
It Is Also Essential In Jet Engine Superalloys, Superconducting Magnets, Electronics, And Other Advanced Technologies.
The Scale Of Luni Gives Australia A Rare Opportunity To Expand Its Role In The Global Supply Of This Specialised Metal, Which Is Currently Dominated By Brazil.
A Key Step In Strengthening Supply Chains
The Major Project Status Designation Signals Canberra’S View Of Luni As A Development With National Economic And Strategic Importance.
Wa1 Says The Recognition Highlights Luni’S Potential To Support Regional Jobs, Bolster Sovereign Capability, And Contribute To Australia’S Growing Critical-Minerals Export Sector.
As Studies Progress, Luni Is Shaping Up As One Of The Country’S Most Important New Mineral Projects — And A Rare Moment Of Global Significance For The Niobium Industry.
ASX:WA1
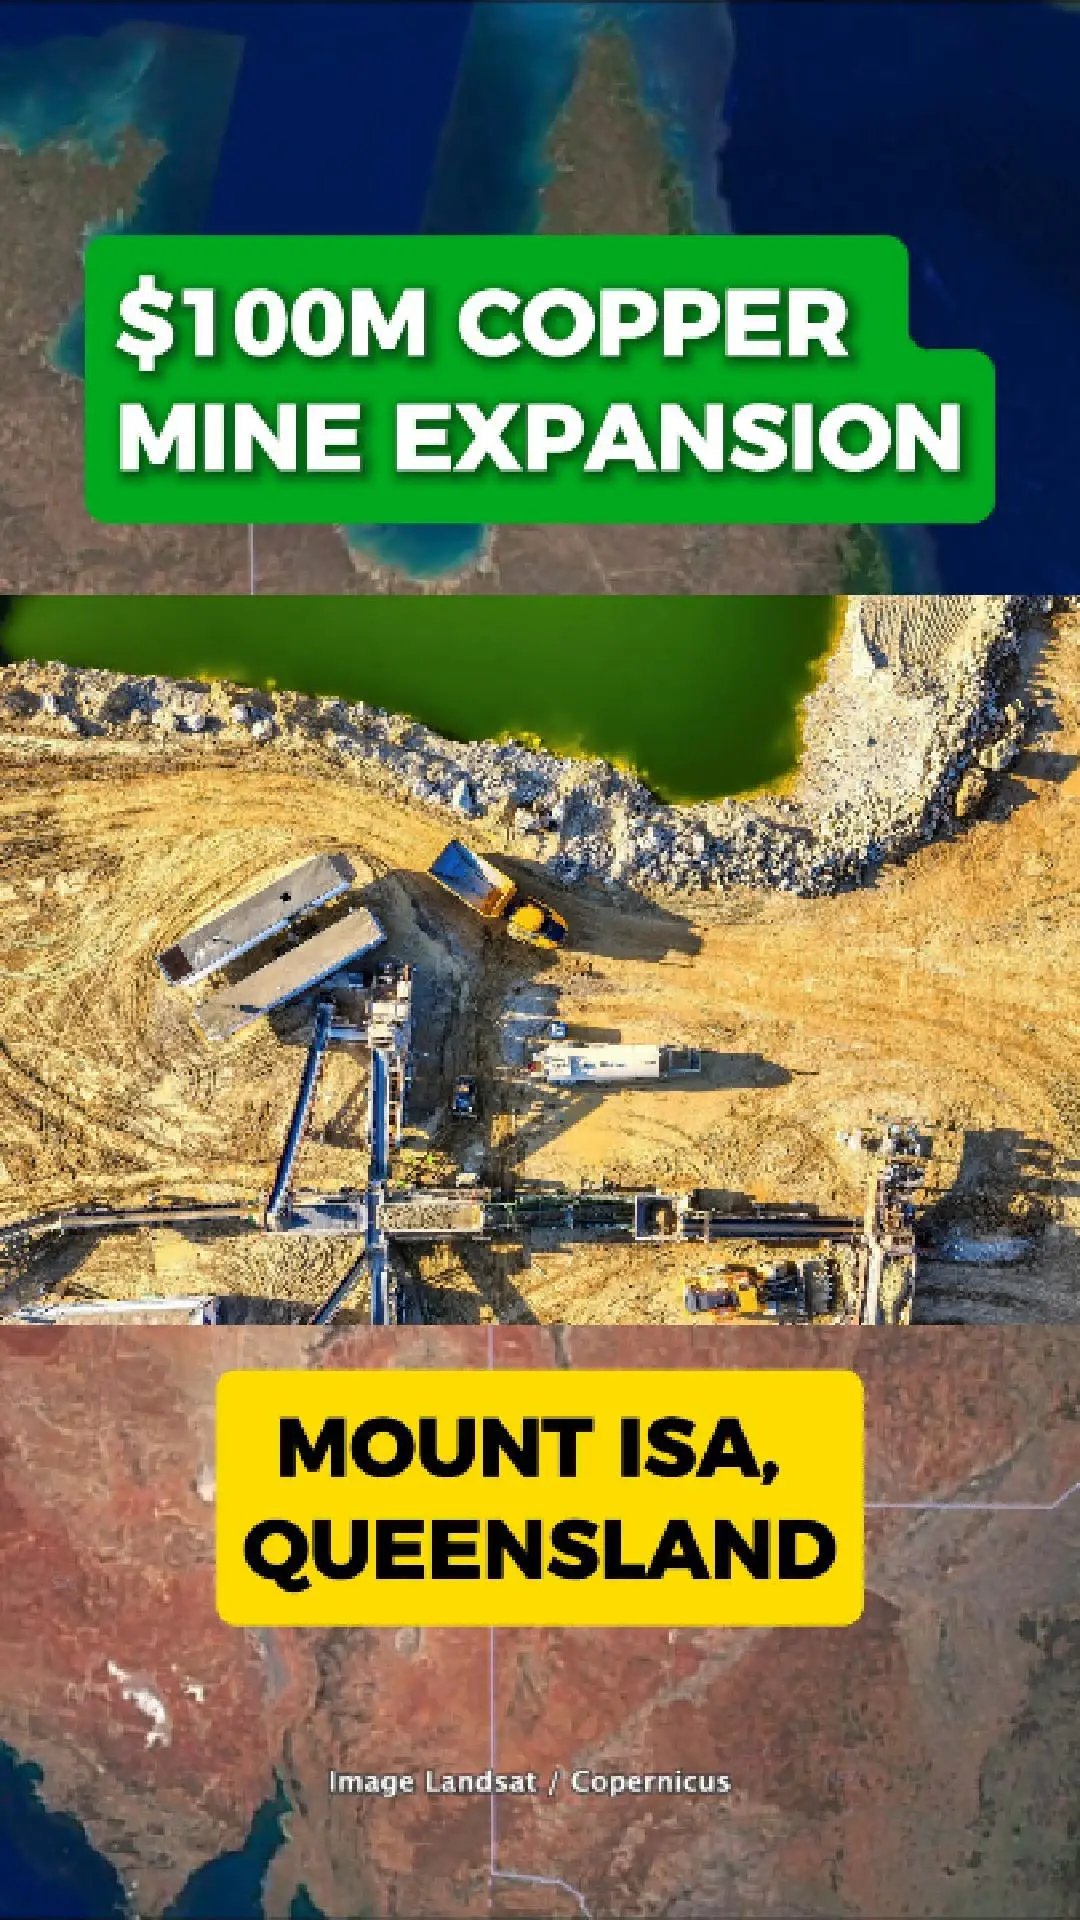
$100 Million Plan To Boost Copper Output In North Queensland
Major Upgrade At Eloise Mine
Aic Mines Is Investing Around $100 Million Into Expanding The Eloise Copper Mine, Located South-East Of Mount Isa In North Queensland. The Project Aims To Modernise The Older Underground Operation And Bring New Life To The Site.
Jericho Deposit Set To Drive Growth
A Key Part Of The Plan Is The Development Of The Nearby Jericho Deposit. Once Opened, Jericho Is Expected To Send About 600,000 Tonnes Of Ore Each Year Into Eloise’S Processing Plant.
Bigger Plant, Bigger Production
To Handle The Extra Ore, Aic Mines Is Expanding The Processing Plant To 1.1 Million Tonnes A Year. Together, The Eloise And Jericho Operations Could Produce Around 20,000 Tonnes Of Copper Annually, Creating A New Copper Hub In The Mount Isa Region.
A Potential Boost For Queensland’S Copper Belt
With Global Demand For Copper Growing, The Combined Project Could Become A Significant Contributor To The State’S Critical Minerals Industry.
Whether This $100 Million Move Sparks Queensland’S Next Copper Boom Remains To Be Seen, But It Marks A Major Step For Aic Mines And The Region’S Mining Future.
ASX:A1M
Popular Stocks 🚀
Show more