M Mc Mining Limited
Revenue: 19.8m
$0.0/sec
MC MINING LIMITED Chat
Something to watch
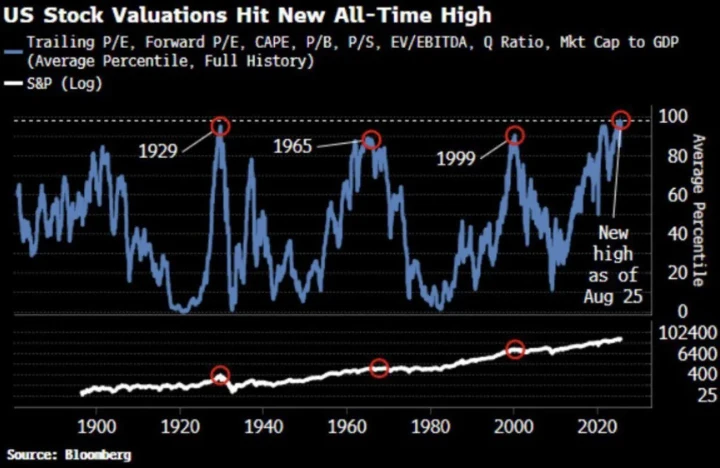
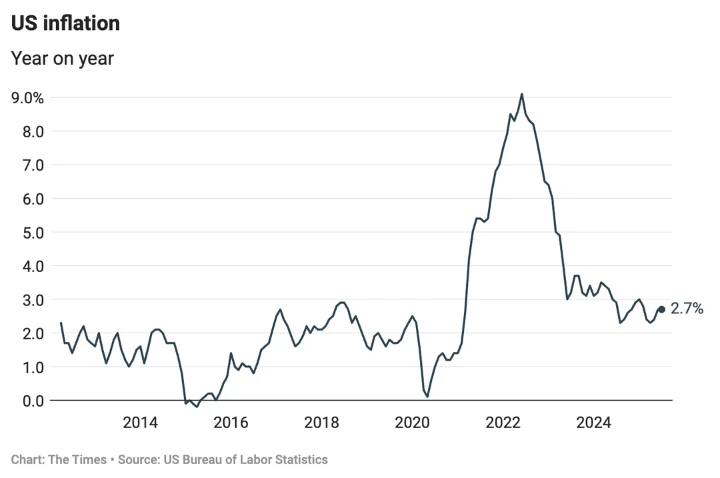
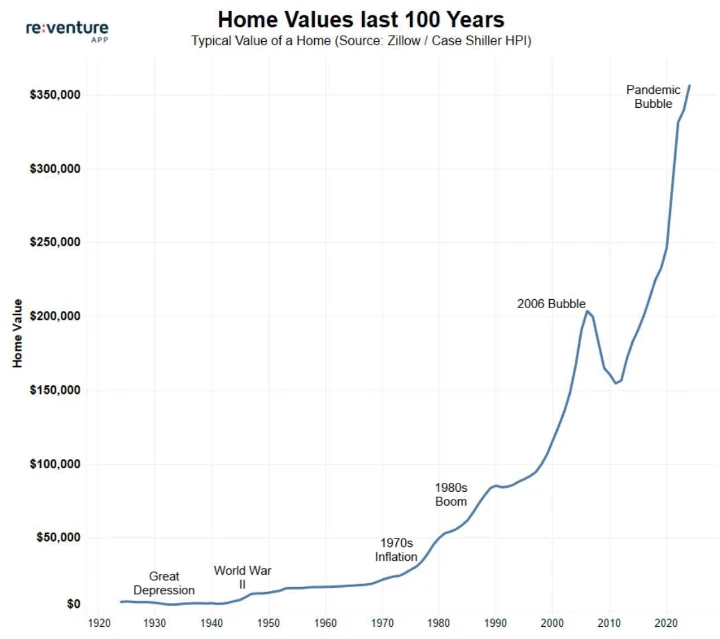
Care for some deflation anyone?
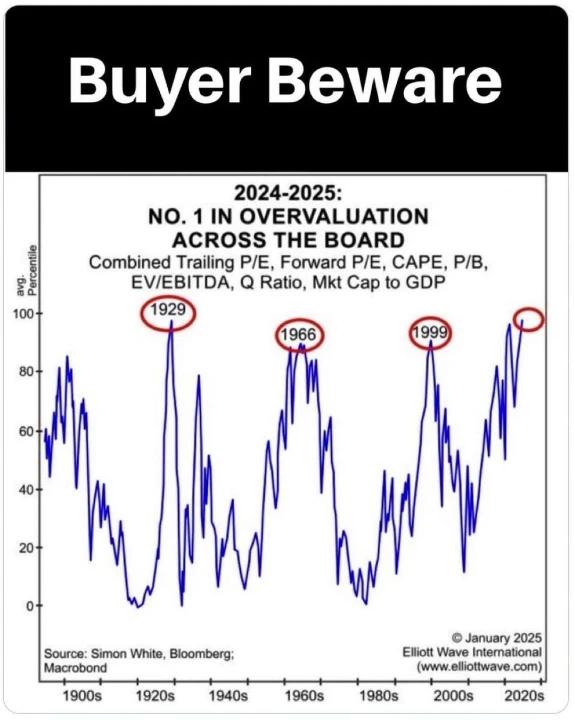
Man this stuff just keeps getting higher and higher... where's the peak or is it all just completely overblown doom and gloom propaganda?
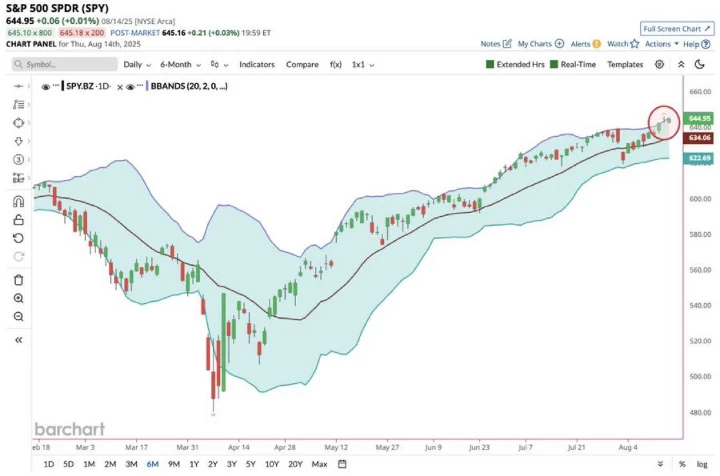
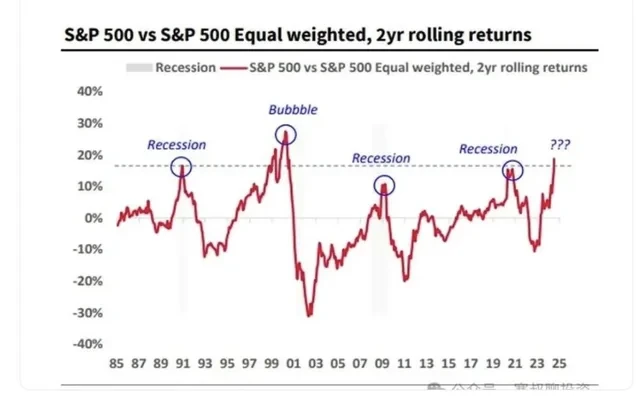
SPY is hitting highs, wonder what comes next, maybe a setup into the usual sell off's in September through October perhaps, food for thought, dyor
Looks like fun
Berkshire is hoarding so. much. cash.


#ASX:TRJ Now looks like a good time to buy with TRJ.
Buffet indicator is showing some wild times ahead perhaps, combine that with Berkshires record high cash hoard of 30%... chart via barchart.com / Longtermtrends
