
$MIN
MinRes Expands Onslow Iron With $3.5B Build
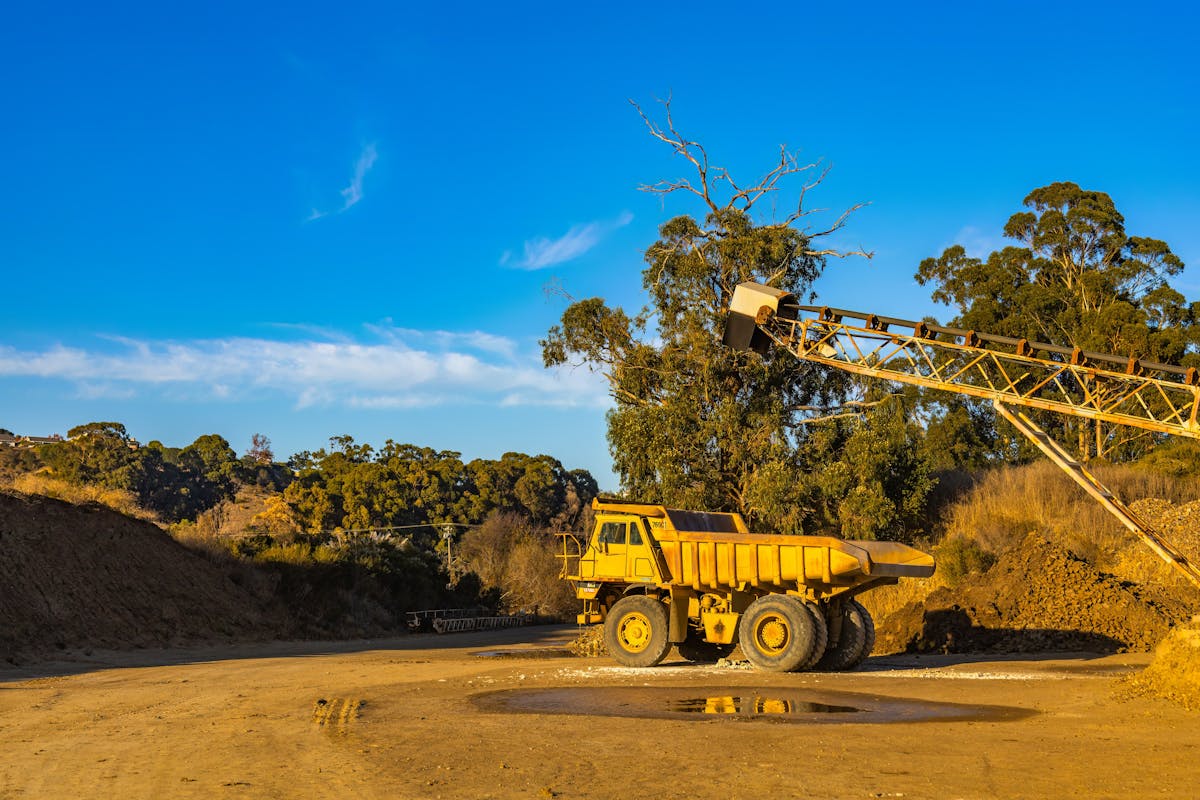
Ken’s Bore mine near Onslow was once empty red desert. Today, it sits at the centre of one of Australia’s largest new iron-ore developments, as Mineral Resources continues to scale up its Onslow Iron project in Western Australia.
New Mines, Port and Haul Road
MinRes is ...
Ken’s Bore mine near Onslow was once empty red desert. Today, it sits at the centre of one of Australia’s largest new iron-ore developments, as Mineral Resources continues to scale up its Onslow Iron project in Western Australia.
New Mines, Port and Haul Road
MinRes is ...
