
M Merino & Co
ASX:MNC
Website
Raise: $7.5m
Price: $0.20
Date: 4 Oct 2024
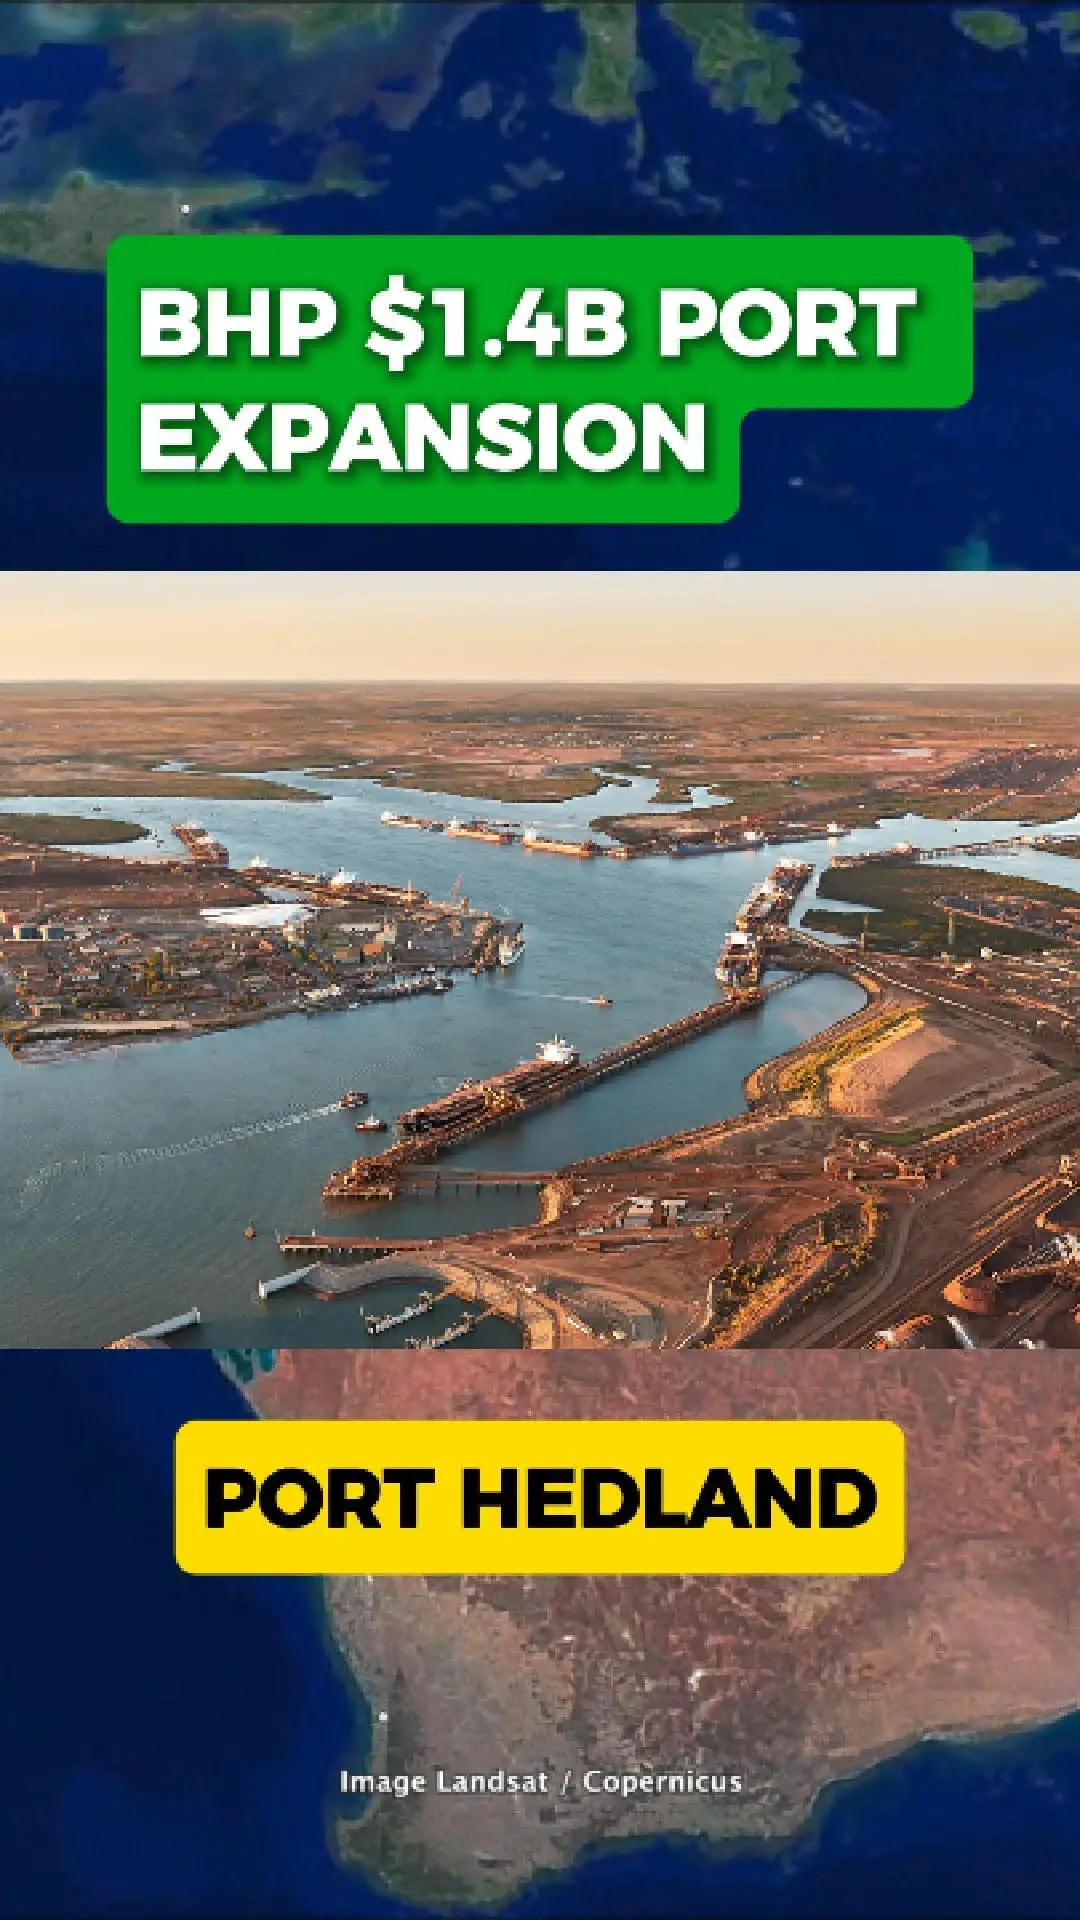
Bhp’S $1.4 Billion Push To Lift Port Hedland Capacity
Bhp Is Investing $1.4 Billion To Upgrade Infrastructure At Port Hedland, The World’S Largest Bulk Export Port And The Backbone Of Australia’S Iron-Ore Industry.
This Port Handles The Ore That Arrives From Bhp’S Giant Pilbara Mines — Brought In By Some Of The Longest Freight Trains On Earth. With Global Demand Rising And Competition Heating Up, Bhp Is Preparing The Port For Its Next Phase Of Growth.
New Rail-Car Dumper And 5km Conveyors
The Major Upgrade Includes:
A New Sixth Rail-Car Dumper
Around Five Kilometres Of New Conveyors
Upgrades To Screening And Transfer Infrastructure
These Additions Are Designed To Move Ore From Train To Ship Faster, Safer And With Fewer Bottlenecks, Supporting Bhp’S Long-Term Target Of 305 Million Tonnes Per Year.
A Strategic Response To Rising Competition
Bhp’S Investment Comes As Rio Tinto And Chinese-Backed Groups Expand Operations In Africa, Including Major New Iron-Ore Developments In Guinea.
Those Projects Could Shift Global Supply Balances Over The Next Decade. Increasing Throughput At Port Hedland Is Part Of Bhp’S Effort To Maintain Its Position As A Leading Low-Cost Iron-Ore Producer.
Is It Enough To Stay Ahead?
The Expansion Will Boost Efficiency And Help Stabilise Output Across Bhp’S Pilbara Network. But With New African Mines Edging Closer And Long-Term Demand Uncertain, The Question Remains:
Will This $1.4 Billion Upgrade Secure Bhp’S Lead — Or Will More Investment Be Needed To Stay In Front?
 ASX:BHP
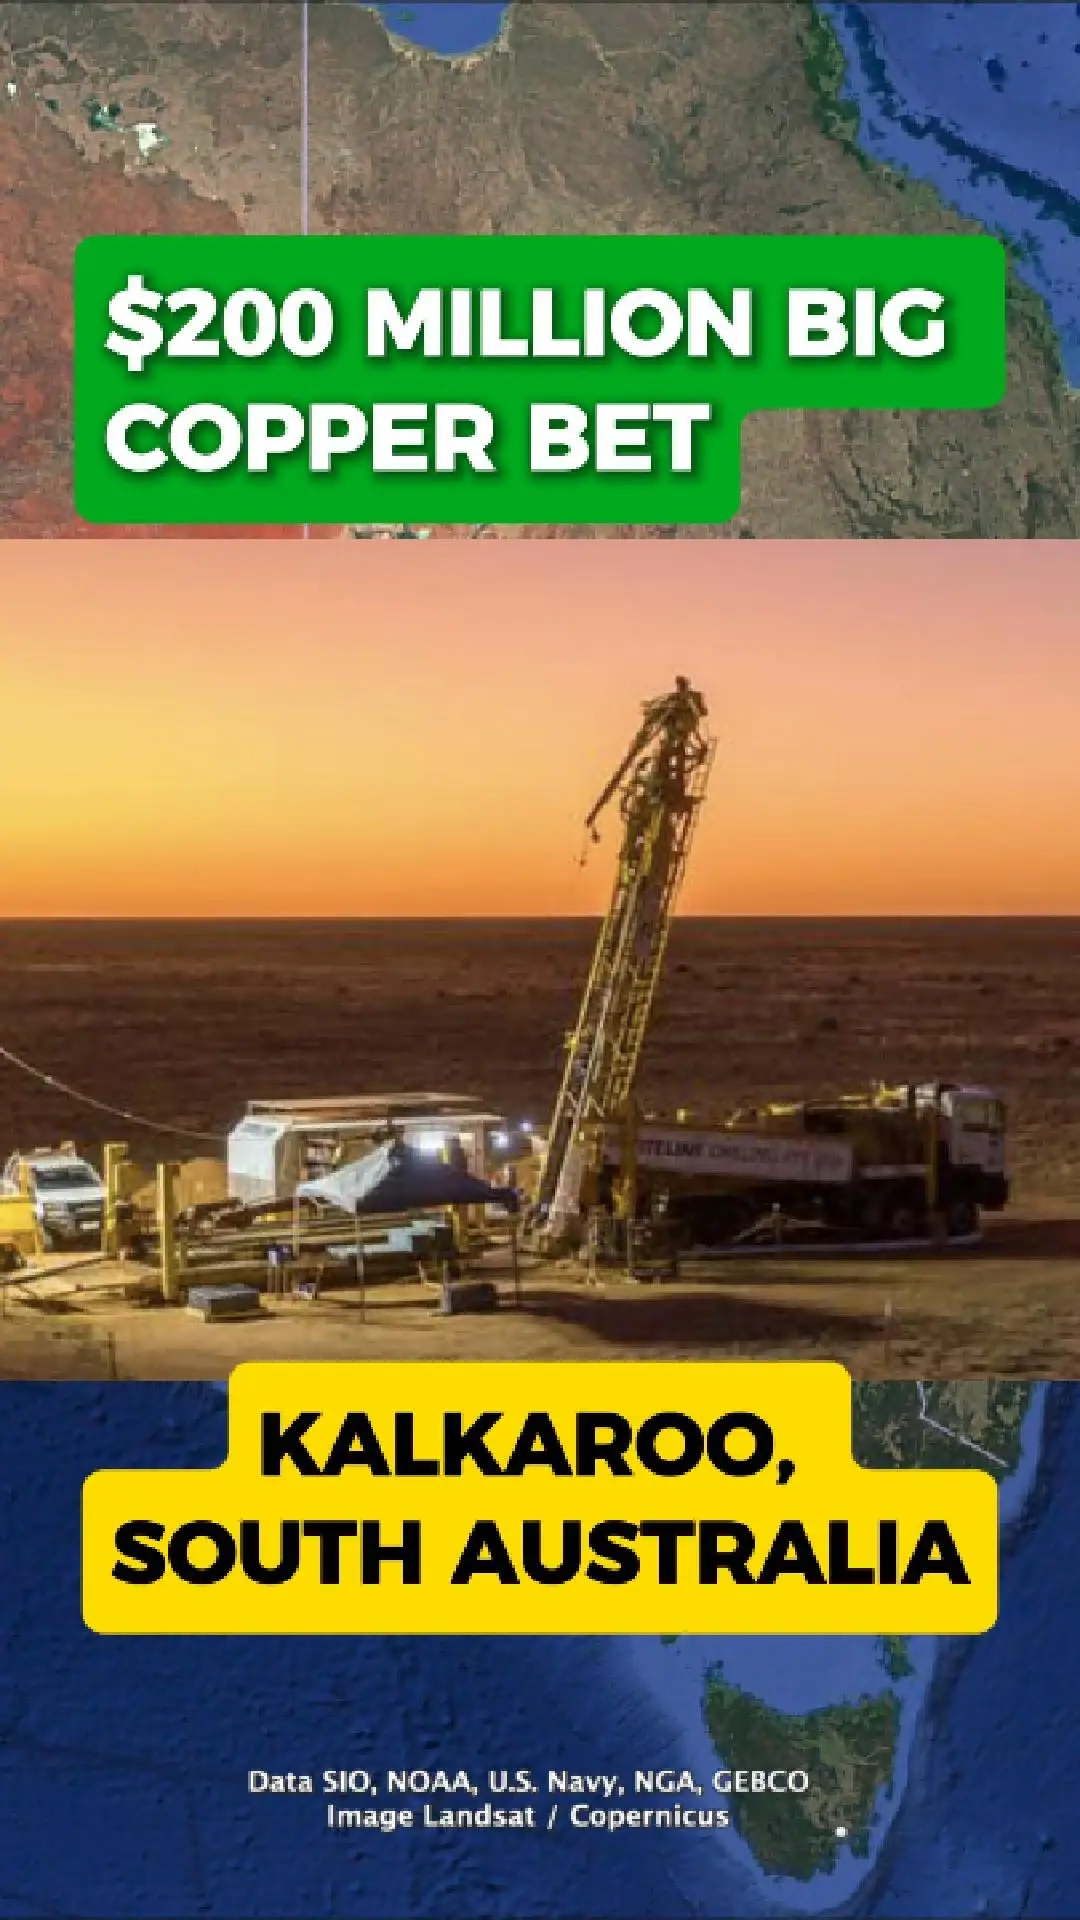
$210 Million Deal Revives Major Copper–Gold Project In South Australia
A Major Funding Agreement Is Breathing New Life Into One Of South Australia’S Most Significant Undeveloped Mineral Deposits. Kalkaroo, Located About 400 Kilometres North Of Adelaide, Holds One Of Australia’S Largest Copper–Gold Resources And Has Been In The Planning Stages For Years Without Moving Into Full Development.
Havilah’S Long-Standing Project Gains Momentum
Owned By Havilah Resources, The Kalkaroo Project Has Remained Idle As The Company Sought The Right Partner To Progress The Orebody Toward Production. Despite Its Size And Potential, The Project Has Not Advanced To Mine Construction, And The Remote Landscape Shows No Surface Infrastructure Or Open-Pit Activity.
Sandfire Commits Up To $210 Million
A New Agreement With Sandfire Resources Is Now Set To Accelerate The Next Phase. Sandfire Has Committed Up To $210 Million Under An Earn-In Structure, Including Funding For Fresh Drilling Aimed At Upgrading And Expanding The Resource Base. The Plan Includes A New Pre-Feasibility Study And Thousands Of Metres Of Drilling To Better Define The Deposit.
Could Kalkaroo Finally Become A Mine?
The Substantial Investment Marks The Most Serious Step Toward Development The Project Has Seen In Years. If The Drilling Program Confirms Its Potential And The Study Demonstrates Economic Viability, Kalkaroo Could Progress Toward Becoming One Of The Next Major Copper–Gold Mines In The Region.
Industry Observers Say The Deal Signals Growing Confidence In South Australia’S Copper Future, Especially As Demand For Copper Continues To Rise Globally.
ASX:HAV

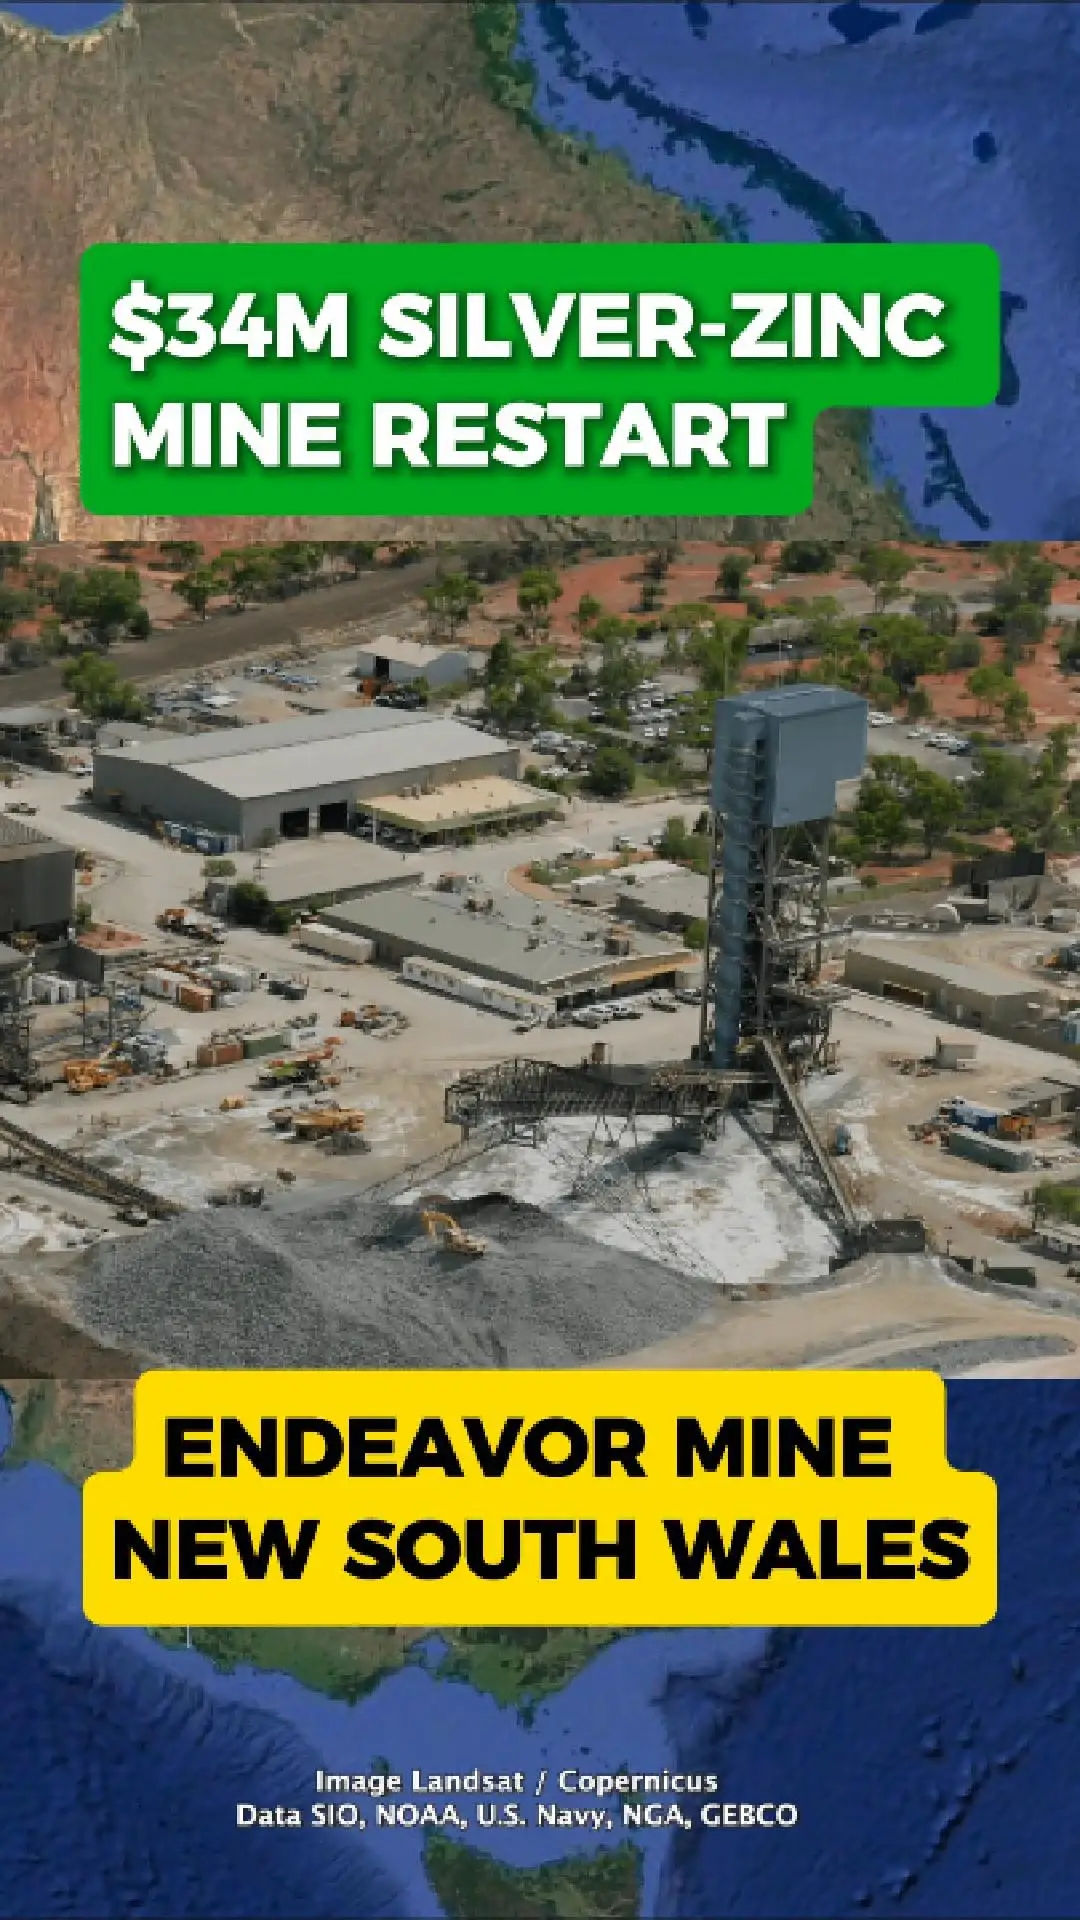
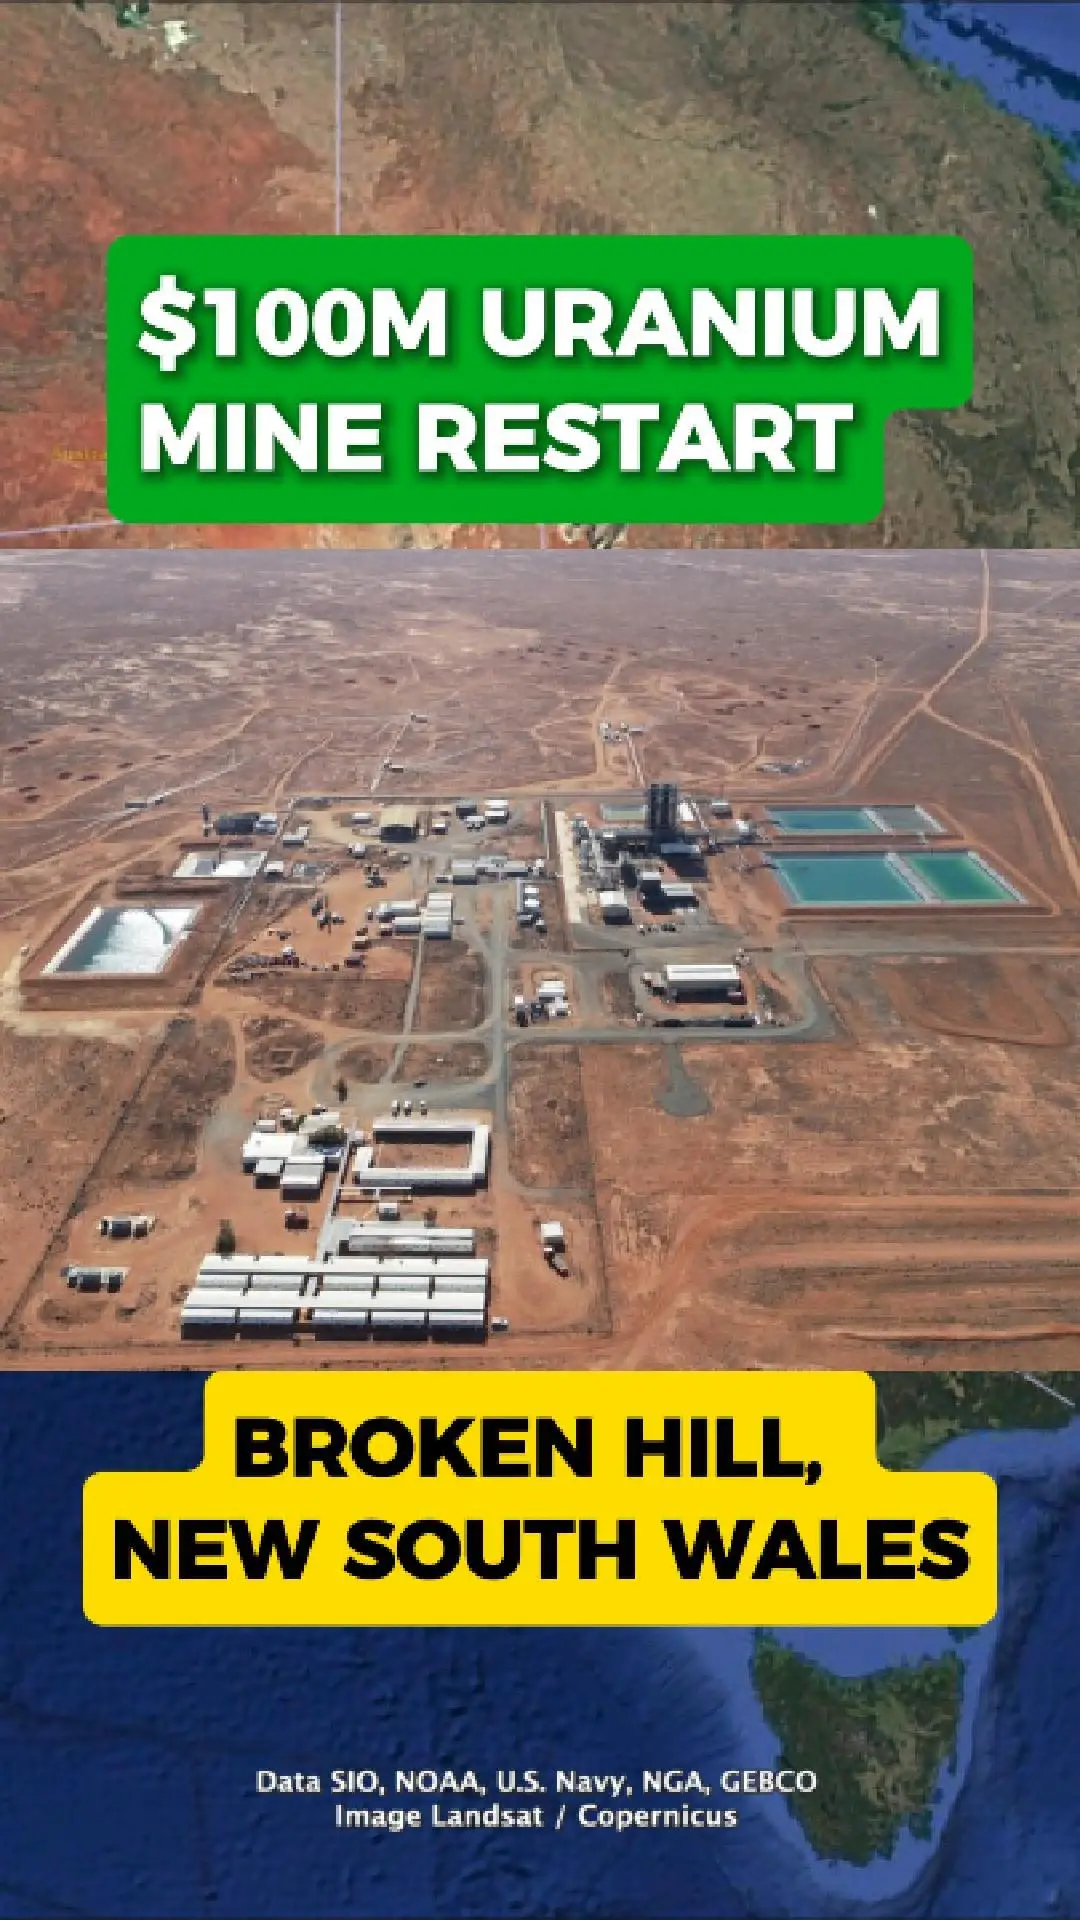
Polymetals Raises Funds To Ramp Up Endeavor Mine
The Endeavor Mine In Outback New South Wales Is Ramping Back Into Production After A Period Of Inactivity. The Historic Silver-Zinc Operation Has Recently Restarted, With Mining Activity Building As The Site Returns To Steady Operations.
$34 Million Capital Raise
Polymetals Resources Has Raised More Than $34 Million Through A Capital Raising To Support The Next Phase Of Work At Endeavor.
The Funds Will Be Used To Accelerate Drilling, Lift Mining Rates, And Strengthen The Company’S Balance Sheet As Production Increases.
Focus On Drilling And Production
The Capital Injection Allows Polymetals To Expand Near-Mine And Regional Drilling Programs While Increasing Mining Activity At The Site. The Company Has Flagged Higher Mining Rates As Operations Progress, Supported By Improving Cashflow From The Restart.
Timely Boost Amid Strong Silver Prices
The Funding Comes At A Time Of Strong Silver Prices, Providing A Favourable Backdrop For The Restart. With Production Ramping Up And Exploration Continuing, Polymetals Is Positioning Endeavor As A Potential Long-Life Asset Within Its Portfolio.
ASX:POL
Popular Stocks 🚀
Show more