
N Neuren Pharmaceuticals Limited
ASX:NEU
Australia
312
Neuren Pharmaceuticals And Acadia Partner To Expand Global License For Trofinetide (Daybue™)
 ASX:NEU
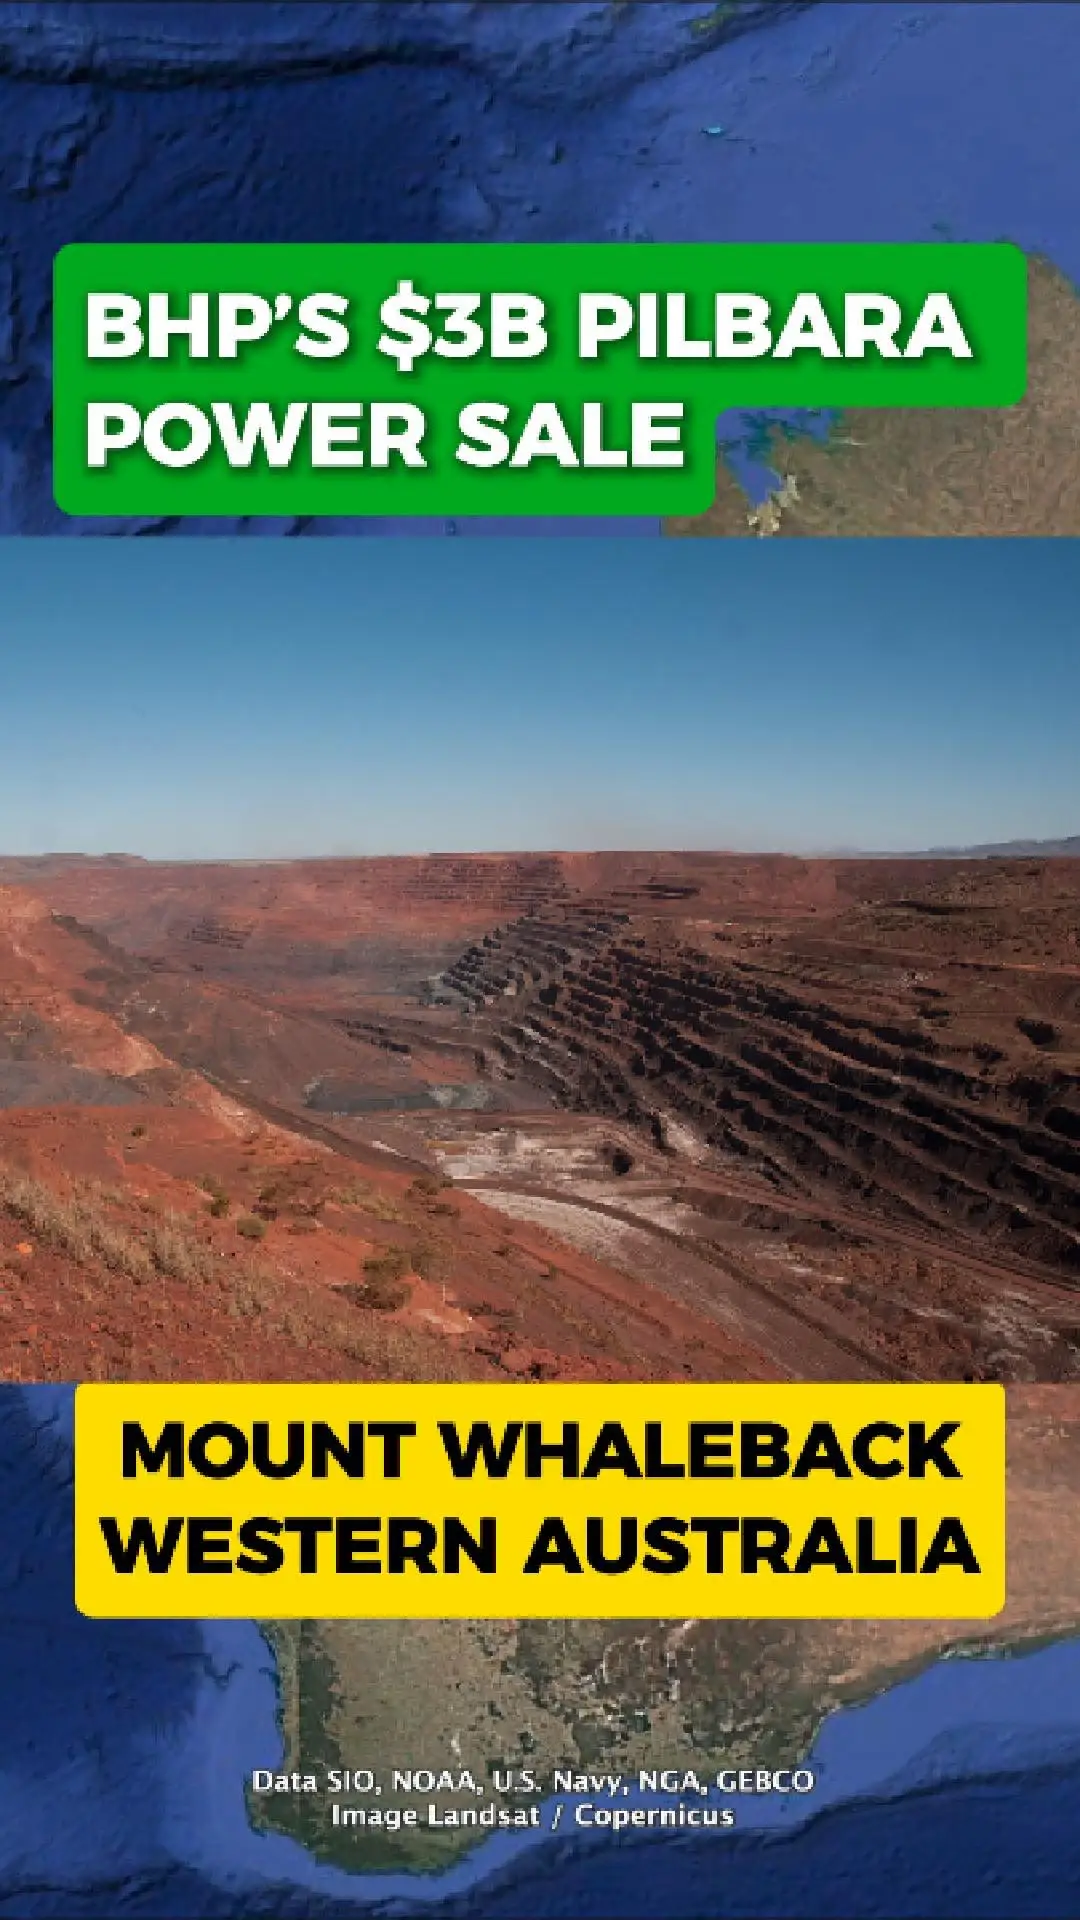
Bhp Sells $3b Stake In Pilbara Power Network
Mount Whaleback — One Of The World’S Largest Open-Cut Iron-Ore Mines — Depends On A Vast Inland Power Network That Keeps Crushers, Haul Roads And Remote Camps Running Across The Pilbara.
This Network Supplies Electricity Not Only To Mount Whaleback, But To Bhp’S Broader Western Australia Iron Ore (Waio) Operations And The Nearby Township Of Newman.
Blackrock Buys Nearly Half
Bhp Has Sold A Near-Half Stake In This Power System To Us Investment Firm Blackrock’S Global Infrastructure Partners Division In A Deal Worth $3 Billion (Aud Equivalent).
Despite The Sale, Bhp Retains Operational Control Of The Network.
The New Structure Means Bhp Will Pay An Agreed Tariff For The Electricity It Uses Over A 25-Year Period.
Freeing Up Capital For Growth
Bhp Says The Move Allows It To Recycle Capital From Long-Life Infrastructure Into Higher-Return Opportunities Across Its Iron-Ore Business.
Industry Analysts Note The Deal Is Aimed At Improving Capital Efficiency While Maintaining Stable Power Supply To Essential Mining Operations.
Why It Matters
Power Reliability Is Core To Pilbara Iron-Ore Production, And The Deal Does Not Affect Existing Agreements With Traditional Owners, The Wa Government, Or Local Communities.
With Global Iron-Ore Competitors Tightening Costs And New Supply Emerging, Bhp Is Positioning Itself To Maintain Long-Term Productivity And Financial Flexibility.
What Happens Next
The Agreement Is Subject To Approval From The Foreign Investment Review Board (Firb), But No Operational Changes Are Expected.
Bhp Has Reiterated Its Medium-Term Goal Of Lifting Pilbara Iron-Ore Output Toward 305 Million Tonnes Per Year.
ASX:BHP
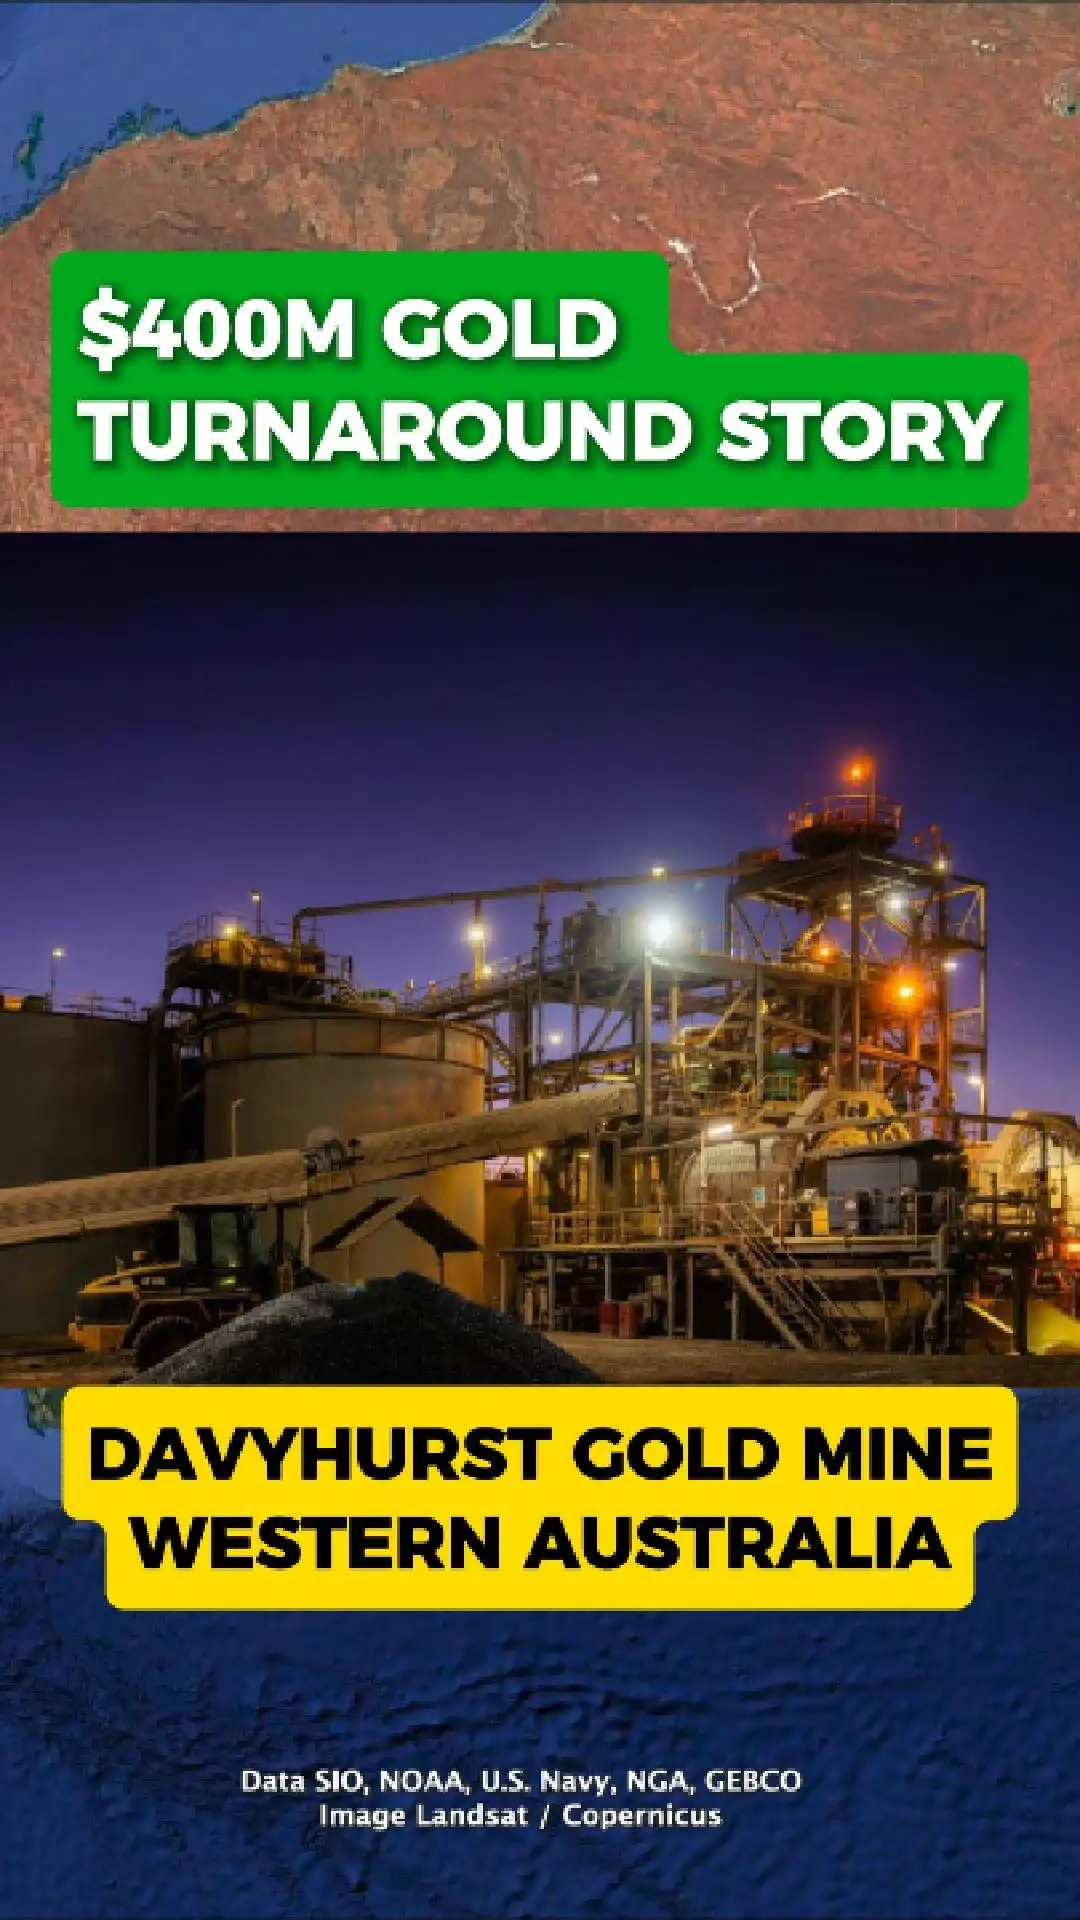
Davyhurst Gold Mine Ramps Up After Turnaround
The Davyhurst Gold Mine In Western Australia Was Once Seen As A Challenged Operation. After A Period Of Underperformance, The Mine Has Now Returned To Growth Following A Major Operational Reset.
Operations Back On Track
Ora Banda Mining Cleaned Up Its Mining And Processing Operations, Improving Reliability And Lifting Gold Output. These Changes Helped Stabilise Production And Improve Overall Performance At The Site.
Strong Financial Results
In 2025, The Company Sold More Than $400 Million Worth Of Gold, Delivering $186 Million In Profit. The Result Reflects Higher Production Levels And Improved Operating Efficiency.
Growth Ahead
With Production Expected To More Than Double By Next Year, Davyhurst Is Entering A New Phase. The Focus Has Shifted From Fixing Problems To Scaling Production, Raising Questions About How Large The Operation Could Become.
ASX:OBM
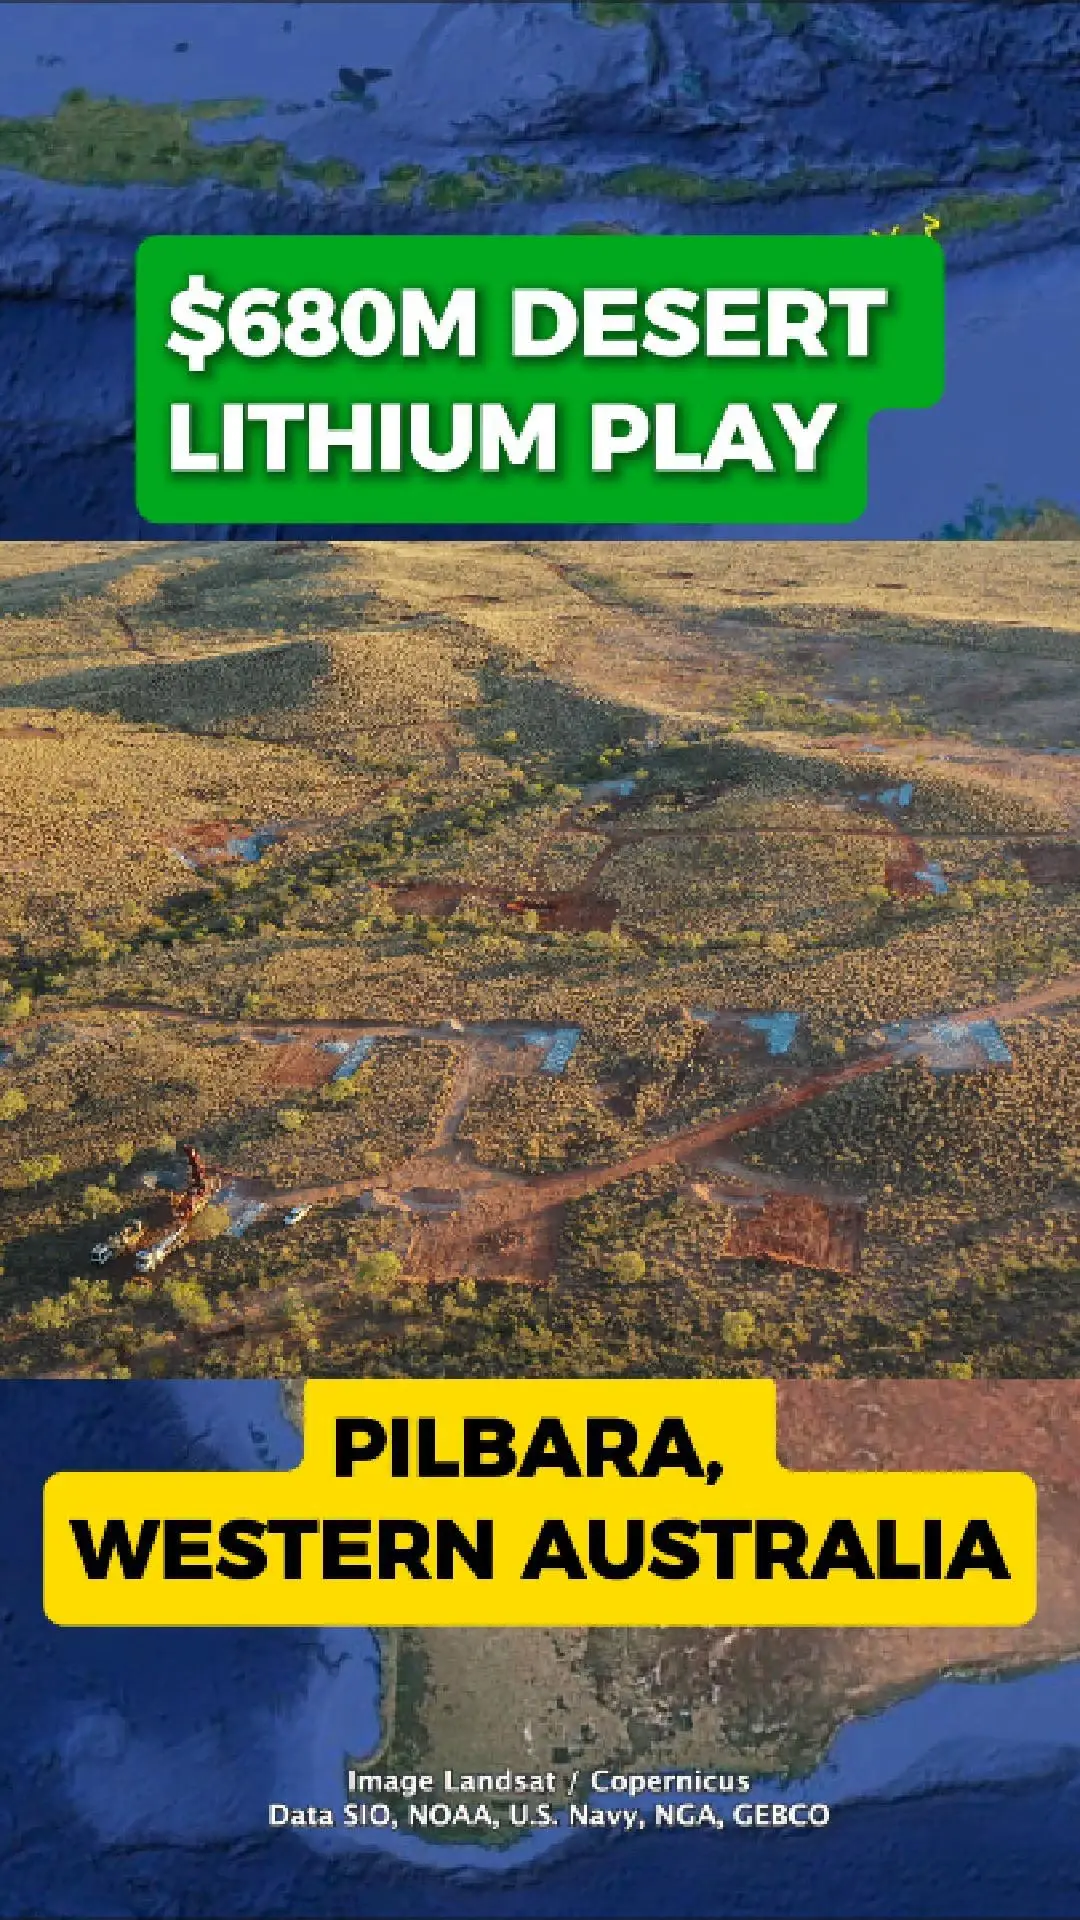
$680m Pilbara Lithium Push Takes Shape At Tabba Tabba
Just Outside Port Hedland, In The Heart Of Western Australia’S Pilbara, Wildcat Resources Is Advancing Its Tabba Tabba Lithium Play — A Rapidly Progressing Project Positioned In One Of The World’S Most Active Battery-Minerals Regions.
The Project Sits Roughly 80 Kilometres From Port Infrastructure, Giving It A Logistical Advantage As Lithium Demand Stabilises.
Pfs Outlines $443m Stage 1 Build
A Recently Completed Pre-Feasibility Study Outlines An Estimated $443 Million Capital Cost For Stage 1 Development, Including Processing Infrastructure Designed To Extract Spodumene Concentrate From Large Pegmatite Bodies On Site.
This Is Complemented By $144 Million In Pre-Strip Mining, Required To Expose The Initial Ore Zones And Prepare The Pit For Early Production.
These Figures Combine For A Total Pre-Production Estimate Of Around $680 Million, Positioning Tabba Tabba As One Of The More Advanced Lithium Developments In The Pilbara.
Why The Project Matters
Wildcat Resources Has Been Pushing The Project Forward With Aggressive Drilling, Resource Expansion, And Technical Studies.
With Mining Leases Granted And Development Studies Underway, Tabba Tabba Is Emerging As A Notable Contender In Western Australia’S Next Wave Of Lithium Supply.
Could It Become A Standout Wa Lithium Mine?
Much Will Depend On Lithium Pricing, Global Supply Dynamics, And The Project’S Final Feasibility Outcomes.
But With Strong Infrastructure Links, A Large-Scale Development Plan, And A Significant Pre-Production Budget, Tabba Tabba Is Firmly On The Radar As One Of Western Australia’S Most Advanced Lithium Projects.
ASX:WC8
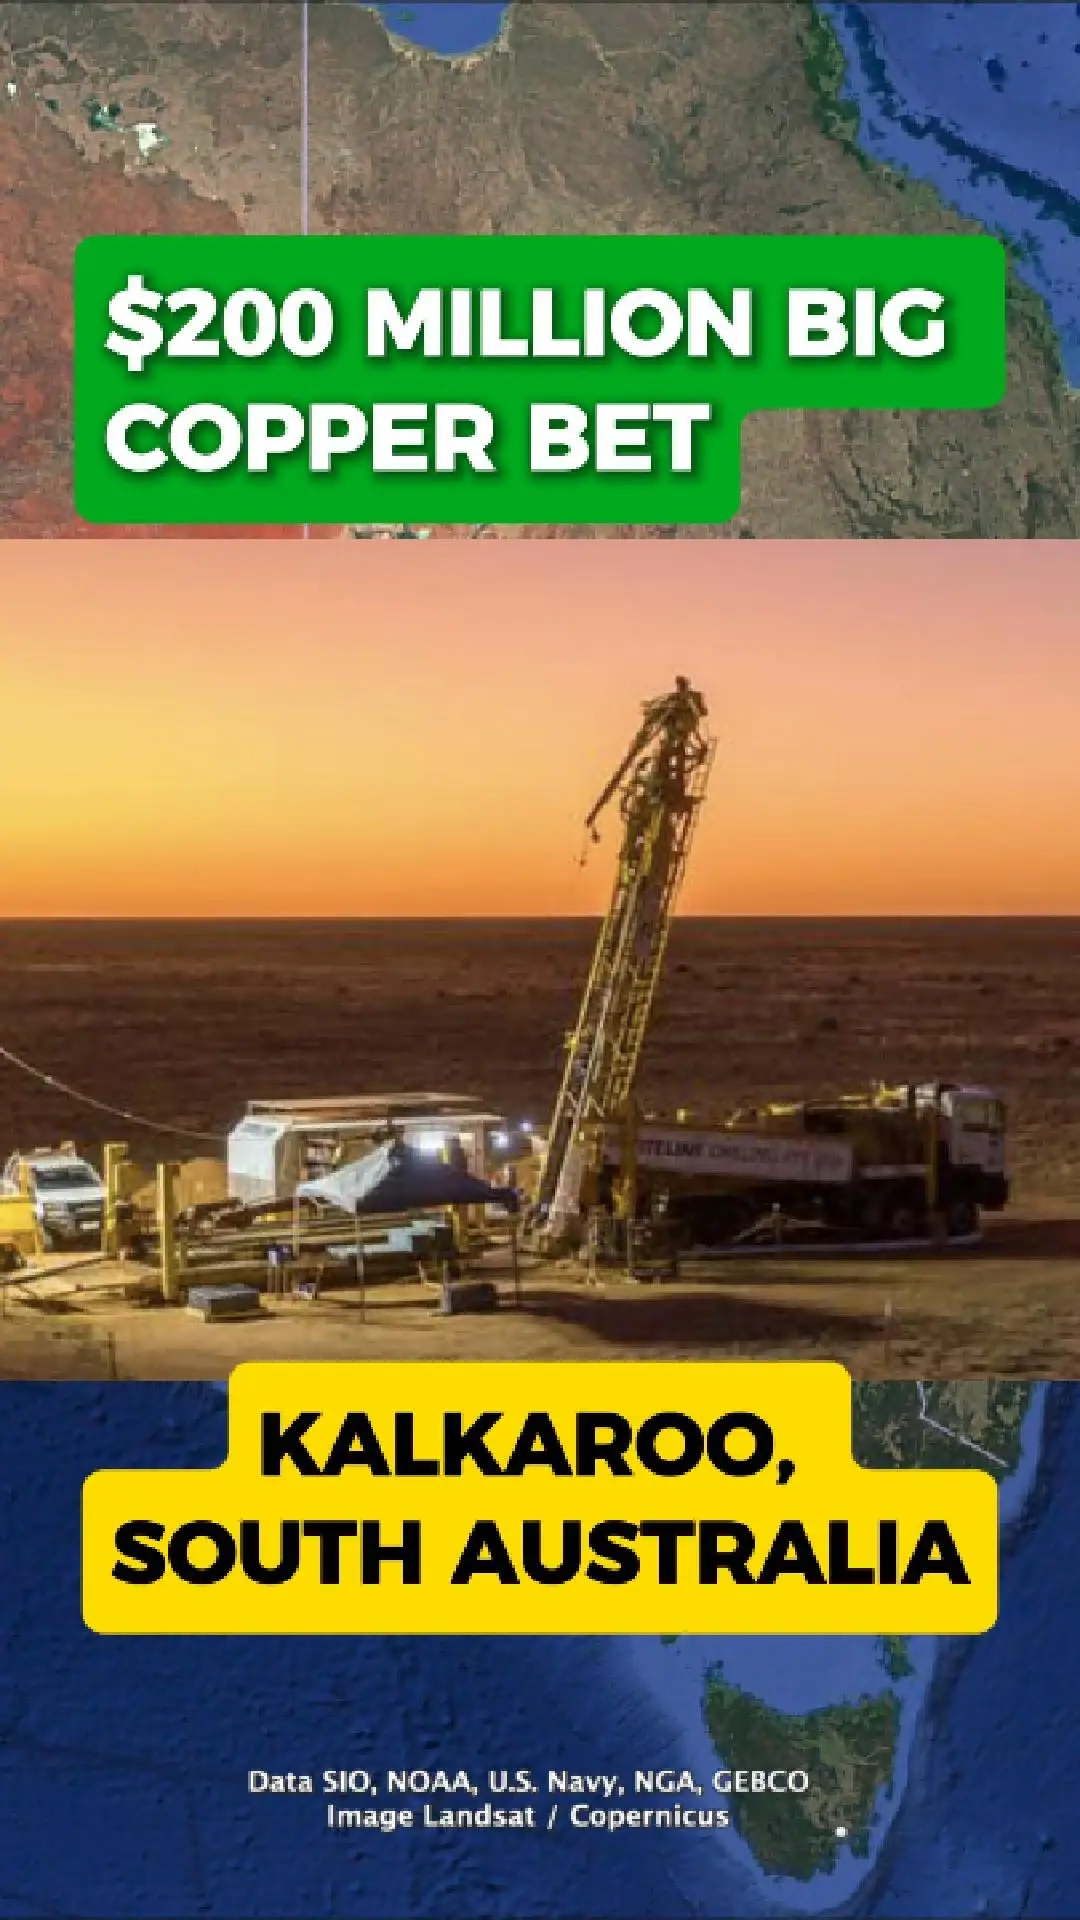
$210 Million Deal Revives Major Copper–Gold Project In South Australia
A Major Funding Agreement Is Breathing New Life Into One Of South Australia’S Most Significant Undeveloped Mineral Deposits. Kalkaroo, Located About 400 Kilometres North Of Adelaide, Holds One Of Australia’S Largest Copper–Gold Resources And Has Been In The Planning Stages For Years Without Moving Into Full Development.
Havilah’S Long-Standing Project Gains Momentum
Owned By Havilah Resources, The Kalkaroo Project Has Remained Idle As The Company Sought The Right Partner To Progress The Orebody Toward Production. Despite Its Size And Potential, The Project Has Not Advanced To Mine Construction, And The Remote Landscape Shows No Surface Infrastructure Or Open-Pit Activity.
Sandfire Commits Up To $210 Million
A New Agreement With Sandfire Resources Is Now Set To Accelerate The Next Phase. Sandfire Has Committed Up To $210 Million Under An Earn-In Structure, Including Funding For Fresh Drilling Aimed At Upgrading And Expanding The Resource Base. The Plan Includes A New Pre-Feasibility Study And Thousands Of Metres Of Drilling To Better Define The Deposit.
Could Kalkaroo Finally Become A Mine?
The Substantial Investment Marks The Most Serious Step Toward Development The Project Has Seen In Years. If The Drilling Program Confirms Its Potential And The Study Demonstrates Economic Viability, Kalkaroo Could Progress Toward Becoming One Of The Next Major Copper–Gold Mines In The Region.
Industry Observers Say The Deal Signals Growing Confidence In South Australia’S Copper Future, Especially As Demand For Copper Continues To Rise Globally.
ASX:HAV
Poll
Popular Stocks 🚀
Show more