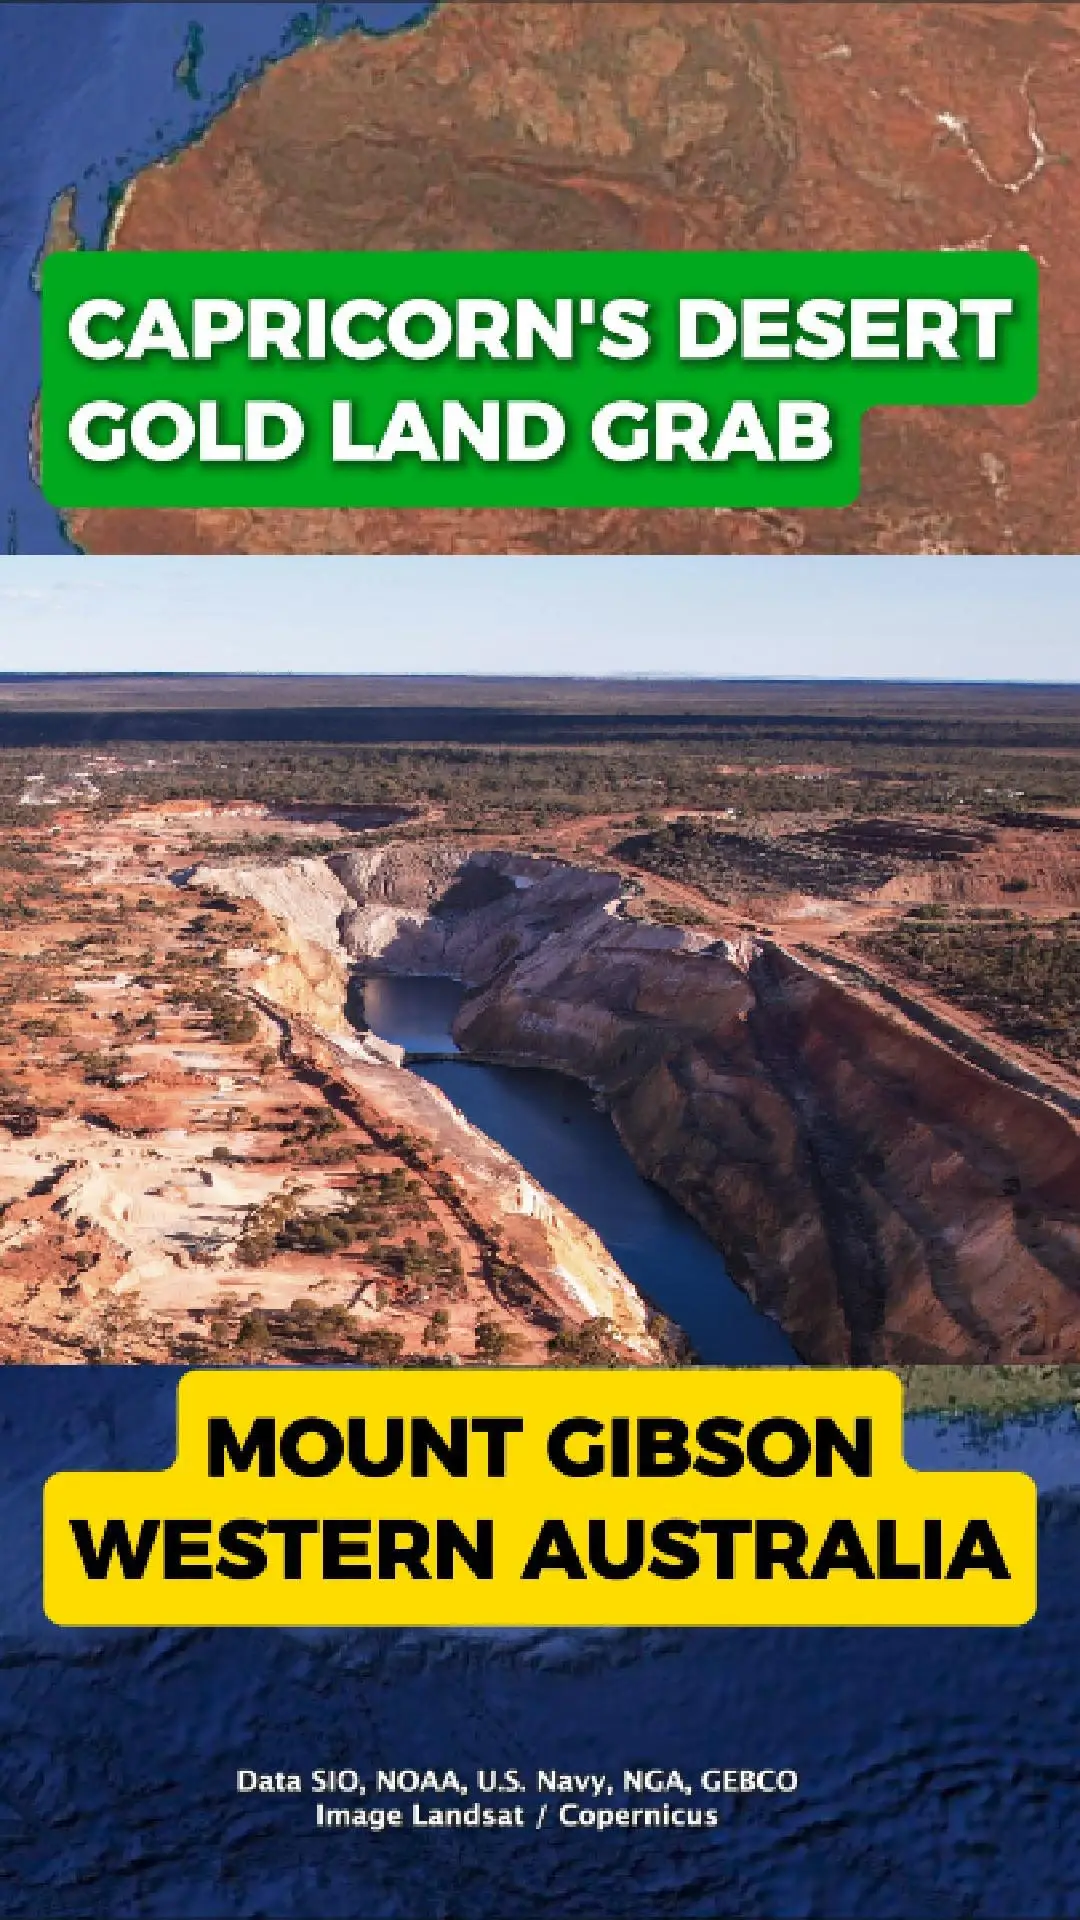
📈 RSI: 54% – ⚪ Neutral – No strong directional bias — consolidation or indecision in the market. RSI measures the speed and size of price moves to gauge momentum. Best used alongside MACD or volume to confirm signals.
📉 MACD Summary
MACD Percentile: 89% – 🟠 MACD is in the top 15% of its yearly range — strong momentum, but possibly in overbought territory.
Momentum Strength: 0.025 – ✅ Bullish Crossover – MACD is rising above its signal line. Short-term trend turning positive.
📊 ADX: 23.0 – 🟡 Forming Trend – Trend may be starting — watch for confirmation and follow-through. ADX measures *trend strength*, not direction. Combine with MACD or moving averages to confirm trend direction and trade signals.
🔊 Volume: 1,714,589 – ⚪ Normal – Trading volume near its average — no strong signal from volume. Volume shows trading activity. High volume confirms trends or news, while low volume may suggest weak follow-through. Often used with RSI and MACD.
📉 Short Interest: 2.69% – ⚪ Light – Only minor short activity — overall sentiment is neutral to slightly bearish. Short interest shows how many traders are betting a stock will fall. Higher values suggest bearish outlook, but also raise short squeeze potential.
Price Trend:
🔁 Early Recovery? — Short-term trend is rising while the 6-month trend remains weak. This may be an early sign of a rebound or bounce. ⚖️ Mild divergence — short- and medium-term signals are not fully aligned.
📏 Z-Score: -1.35 – 🟡 Slightly Below Avg – Trading at a small discount — possibly undervalued if fundamentals are solid. Z-Score shows how far price deviates from its seasonal mean. Useful for spotting extreme overbought or oversold levels over time.
📅 This Month: 62% Consistently Up 📊 Avg Return: 0.11% | 📈 Current Return: 1.65% 🟢 Reasonable Edge – Solid past performance.
📅 Next Month: 38% Consistently Up 📊 Avg Return: -2.73% 🟠 Often Weak – More losses than gains.
*These charts and explainers are for educational and informational purposes only. This is not financial advice. Company data is sourced from public APIs and may not be 100% accurate — it's intended as a general overview only.*
📈 RSI: 54% – ⚪ Neutral – No strong directional bias — consolidation or indecision in the market. RSI measures the speed and size of price moves to gauge momentum. Best used alongside MACD or volume to confirm signals.
📉 MACD Summary
MACD Percentile: 89% – 🟠 MACD is in the top 15% of its yearly range — strong momentum, but possibly in overbought territory.
Momentum Strength: 0.025 – ✅ Bullish Crossover – MACD is rising above its signal line. Short-term trend turning positive.
📊 ADX: 23.0 – 🟡 Forming Trend – Trend may be starting — watch for confirmation and follow-through. ADX measures *trend strength*, not direction. Combine with MACD or moving averages to confirm trend direction and trade signals.
🔊 Volume: 1,714,589 – ⚪ Normal – Trading volume near its average — no strong signal from volume. Volume shows trading activity. High volume confirms trends or news, while low volume may suggest weak follow-through. Often used with RSI and MACD.
Price Trend: 🔁 Early Recovery? — Short-term trend is rising while the 6-month trend remains weak. This may be an early sign of a rebound or bounce. ⚖️ Mild divergence — short- and medium-term signals are not fully aligned.
Coles to replace warehouse workers with an automated warehouse. - Well I for one welcome our new AI overlords. In all seriousness, interest rates won’t be the only thing increasing the unemployment rate up.