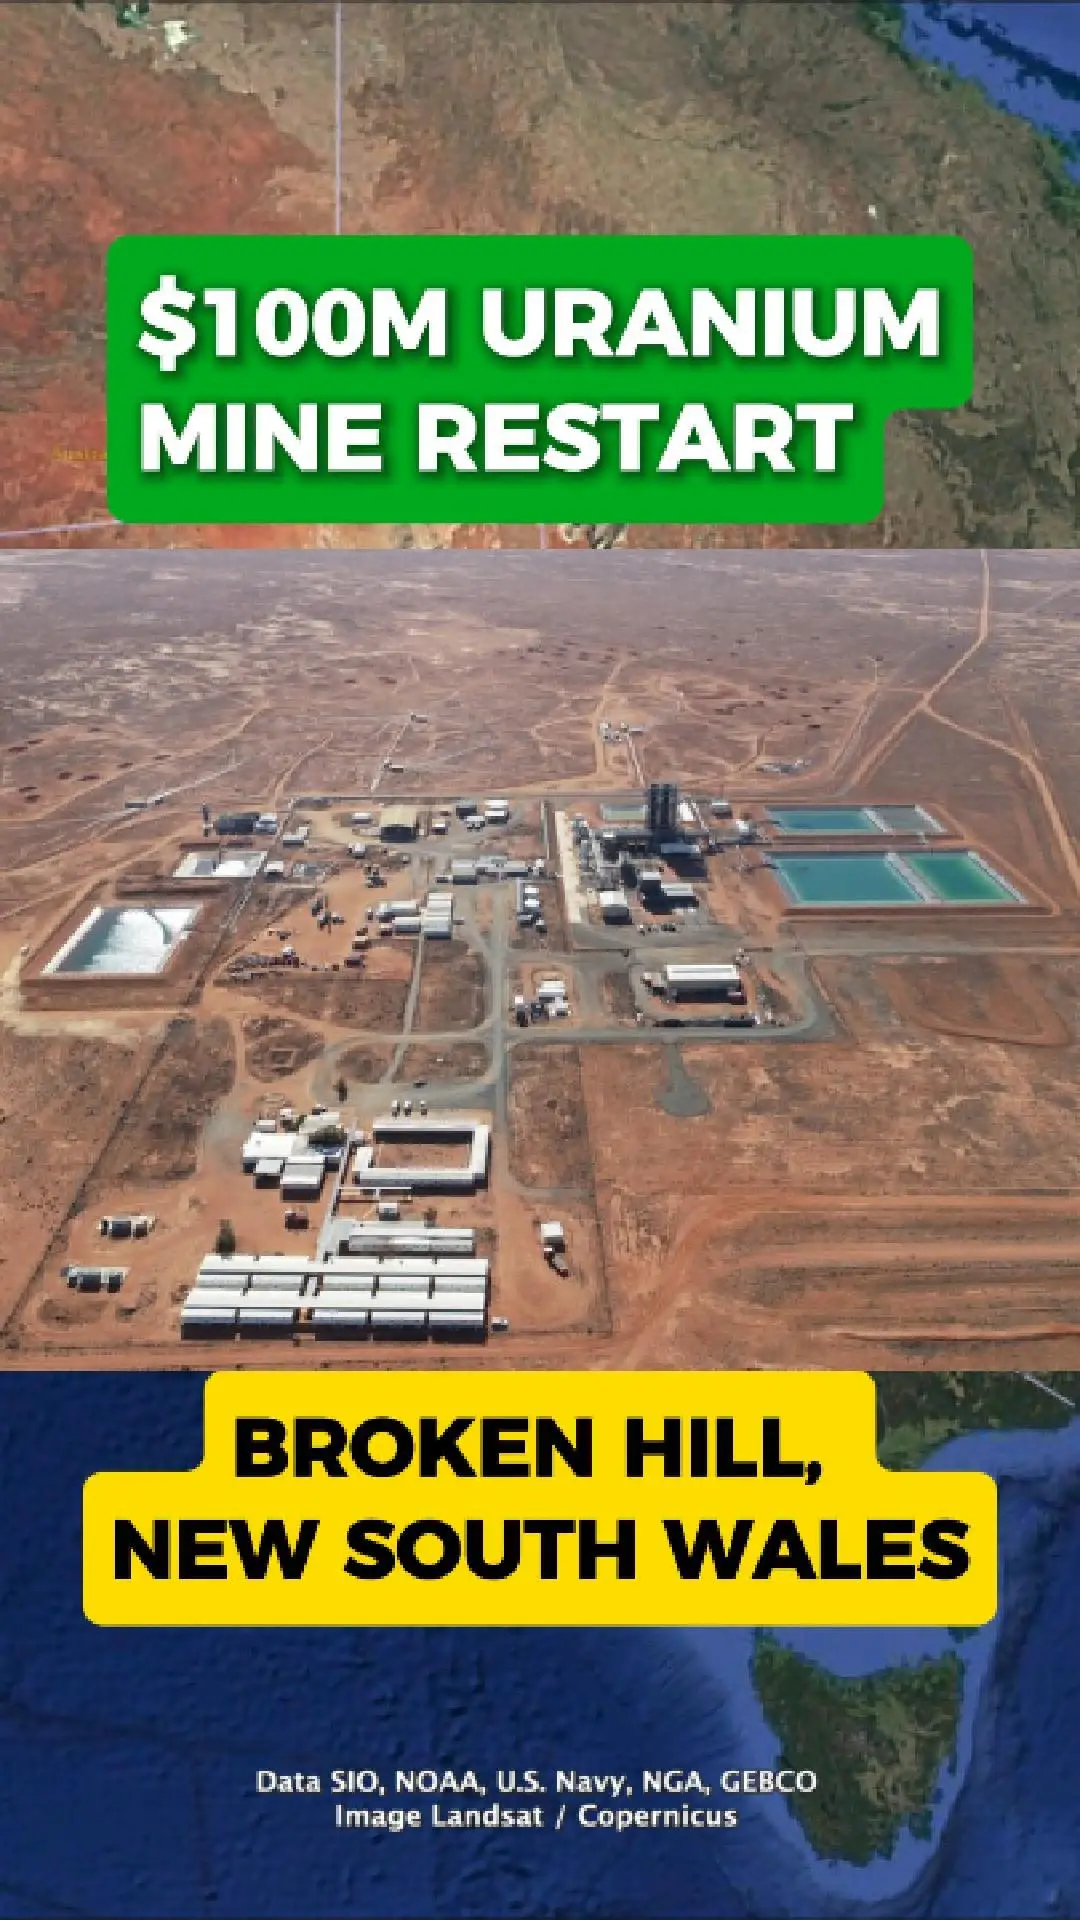
ASX:PARAustraliaPharmaceuticals, Biotechnology & Life Sciences
by TradingView
PAR Analysis - LykeShares.com
Price, Momentum & Seasonality Insights for 2025 (Paradigm Biopharmaceuticals Limited..)
LykeShares.com
PAR Cheat Sheet - LykeShares.com
📈 RSI: 51% – ⚪ Neutral – No strong directional bias — consolidation or indecision in the market. RSI measures the speed and size of price moves to gauge momentum. Best used alongside MACD or volume to confirm signals.
📉 MACD Summary
MACD Percentile: 84% – 🟢 MACD is above average — bullish momentum is healthy and trending upward.
Momentum Strength: -0.006 – 🟠 Mild Bearish Crossover – MACD just dipped under signal. Weakening short-term momentum.
📊 ADX: 35.1 – 🟢 Strong Trend – A clear and lasting trend is in place. Momentum is strong. ADX measures *trend strength*, not direction. Combine with MACD or moving averages to confirm trend direction and trade signals.
🔊 Volume: 773,996 – ⚪ Normal – Trading volume near its average — no strong signal from volume. Volume shows trading activity. High volume confirms trends or news, while low volume may suggest weak follow-through. Often used with RSI and MACD.
📉 Short Interest: 0.19% – 🟢 Very Low – Very few traders betting against this stock — confidence is high or interest is low. Short interest shows how many traders are betting a stock will fall. Higher values suggest bearish outlook, but also raise short squeeze potential.
Price Trend:
🧯 Decline Slowing — Medium-term trend is negative, but losses are softening. Short-term movement shows possible stabilization.
📏 Z-Score: +0.15 – ⚪ Near Average – Price is close to its seasonal or historical average — fairly valued. Z-Score shows how far price deviates from its seasonal mean. Useful for spotting extreme overbought or oversold levels over time.
📅 This Month: 62% Consistently Up 📊 Avg Return: 6.37% | 📈 Current Return: 21.33% 🟢 Reasonable Edge – Solid past performance.
📅 Next Month: 38% Consistently Up 📊 Avg Return: -5.12% 🟠 Often Weak – More losses than gains.
*These charts and explainers are for educational and informational purposes only. It is not financial advice.*
📈 RSI: 51% – ⚪ Neutral – No strong directional bias — consolidation or indecision in the market. RSI measures the speed and size of price moves to gauge momentum. Best used alongside MACD or volume to confirm signals.
📉 MACD Summary
MACD Percentile: 84% – 🟢 MACD is above average — bullish momentum is healthy and trending upward.
Momentum Strength: -0.006 – 🟠 Mild Bearish Crossover – MACD just dipped under signal. Weakening short-term momentum.
📊 ADX: 35.1 – 🟢 Strong Trend – A clear and lasting trend is in place. Momentum is strong. ADX measures *trend strength*, not direction. Combine with MACD or moving averages to confirm trend direction and trade signals.
🔊 Volume: 773,996 – ⚪ Normal – Trading volume near its average — no strong signal from volume. Volume shows trading activity. High volume confirms trends or news, while low volume may suggest weak follow-through. Often used with RSI and MACD.
Price Trend: 🧯 Decline Slowing — Medium-term trend is negative, but losses are softening. Short-term movement shows possible stabilization.
Coles to replace warehouse workers with an automated warehouse. - Well I for one welcome our new AI overlords. In all seriousness, interest rates won’t be the only thing increasing the unemployment rate up.