ASX:PLS
— ASX Mining News & Discussion | PILBARA MINERALS LIMITED
P
Pilbara Minerals Limited
$PLS
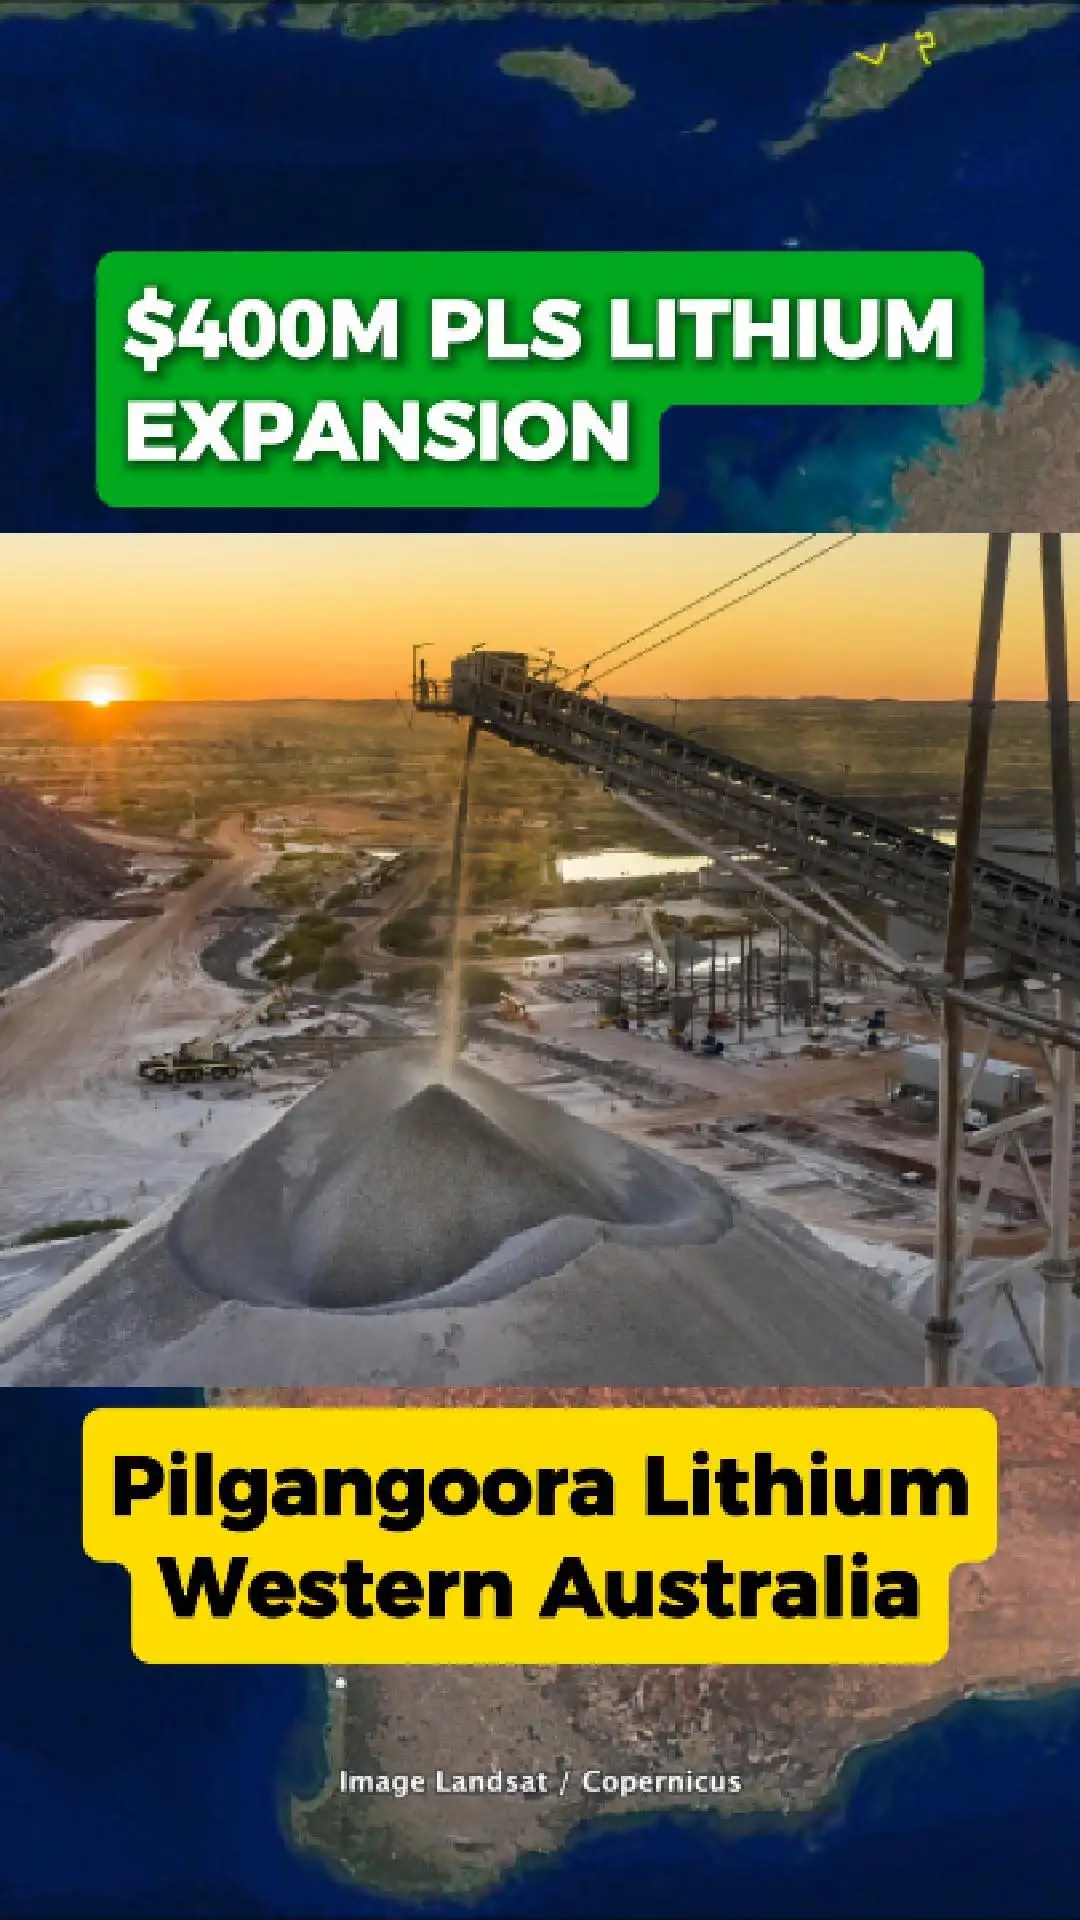
Pilbara Minerals’ $400M Lithium Expansion: One Year On
$PLS
PLS To Takeover Latin Resources in huge deal
$PLS
Why are Pilbara Minerals and Ganfeng partnering up?
$PLS
Pilbara Minerals Accepts Pre-Auction Offer, Solidifying Lithium Supply Ahead of BMX Auction
$PLS
How did Pilbara Minerals maintain strong EBITDA despite lower lithium prices?
$PLS
Why is Pilbara Minerals Growing its Offtake Agreement with Chengxin?
$PLS
How Much of Pilbara Minerals Do the Directors Own?
$PLS
How Did Pilbara Minerals Achieve a 22% Increase in Production in the December Quarter?
$PLS
Who Are the Largest Investors Behind Pilbara Minerals?
$PLS
Pilbara Minerals Amplifies Ganfeng Offtake Agreement: A Strategic Move in Lithium Market
$PLS
What is Pilbara Minerals' Power Strategy and How Does It Aim to Reduce Emissions?
$PLS
Who is Luke Bortoli? CFO of Pilbara Minerals
$PLS
What Does Pilbara Resources Produce and What Are It's Future Plans?
$PLS
Who is Dale Henderson, CEO of Pilbara Minerals, and How is he operating PLS?
$PLS
Why is Pilbara Minerals the Most Shorted Stock on the ASX?
Loading more...