ASX:PNR
— ASX Mining News & Discussion | PANTORO LIMITED
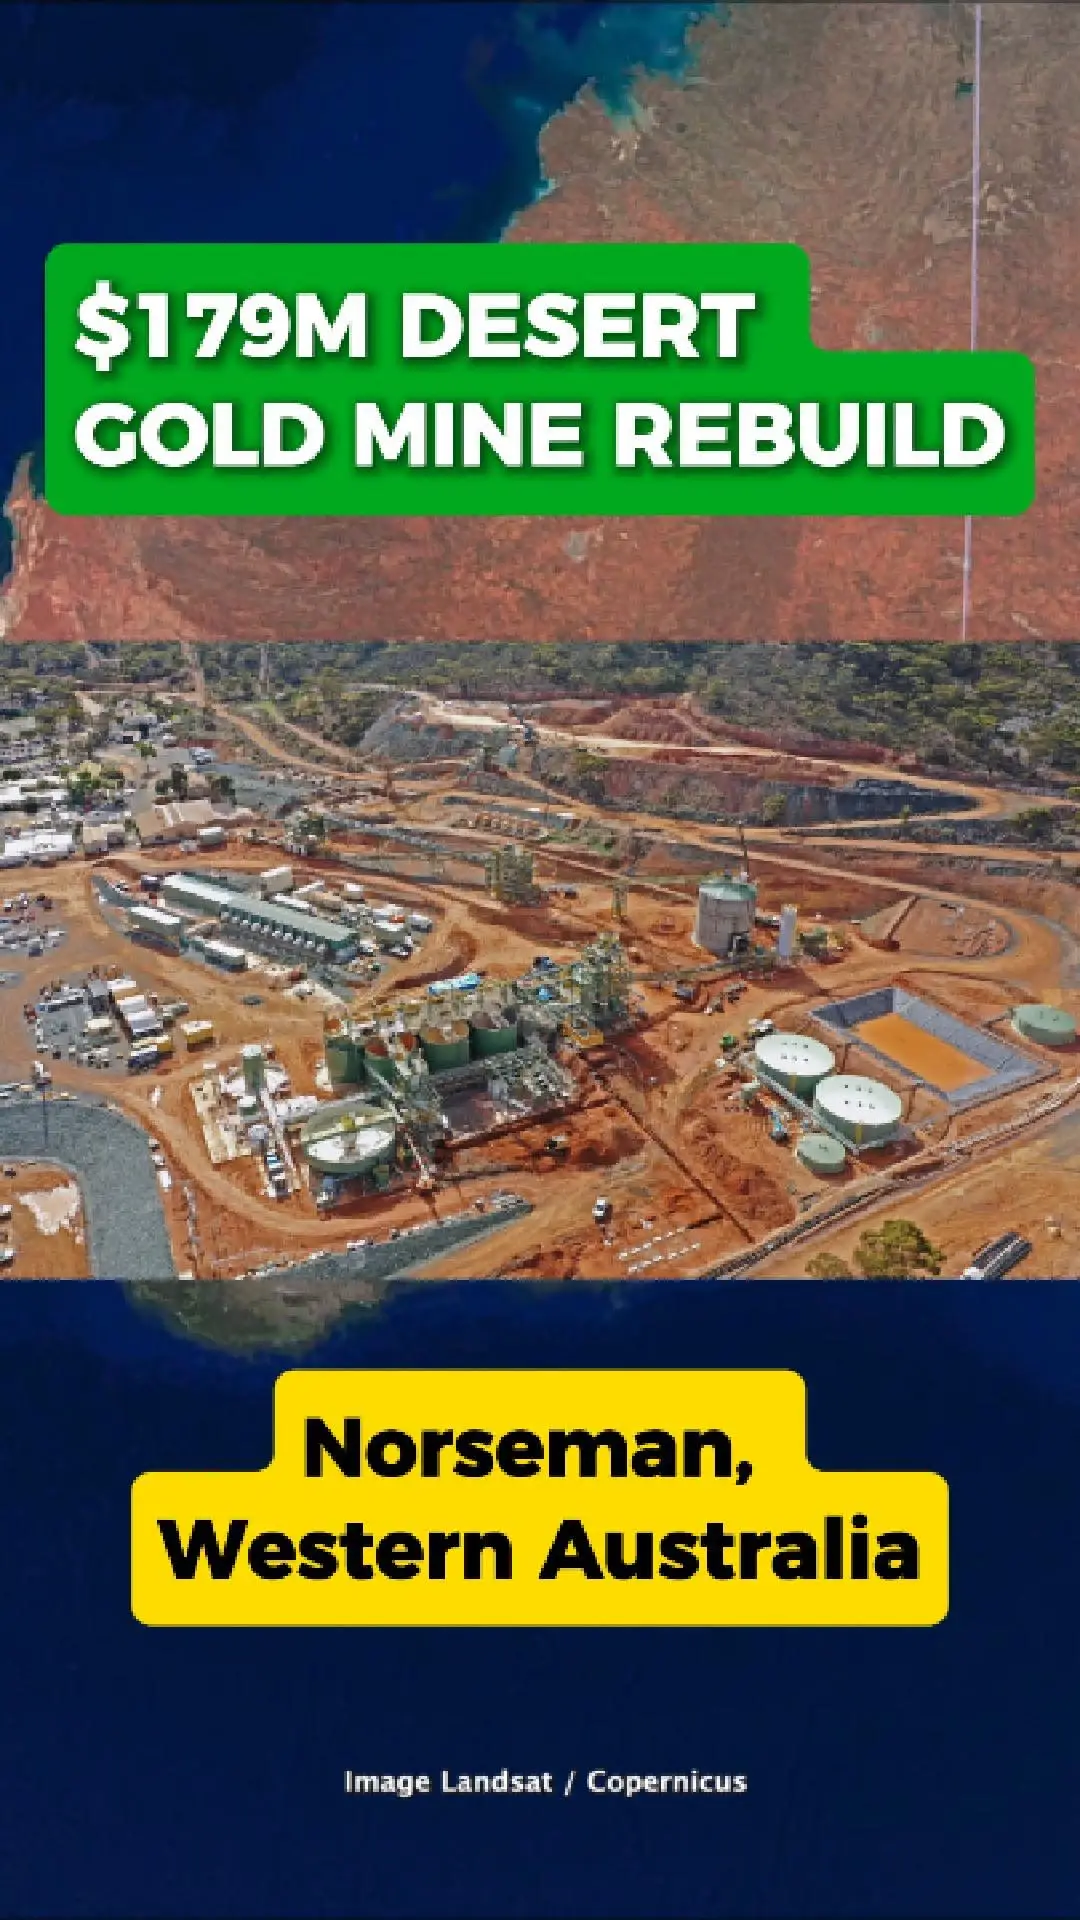
$179M Desert Gold Mine Rebuild at Norseman
How does Pantoro plan to enhance its production output further in the future?
What Led Pantoro to Sell its Norseman Lithium and Base Metals Rights to Mineral Resources?
Loading more...