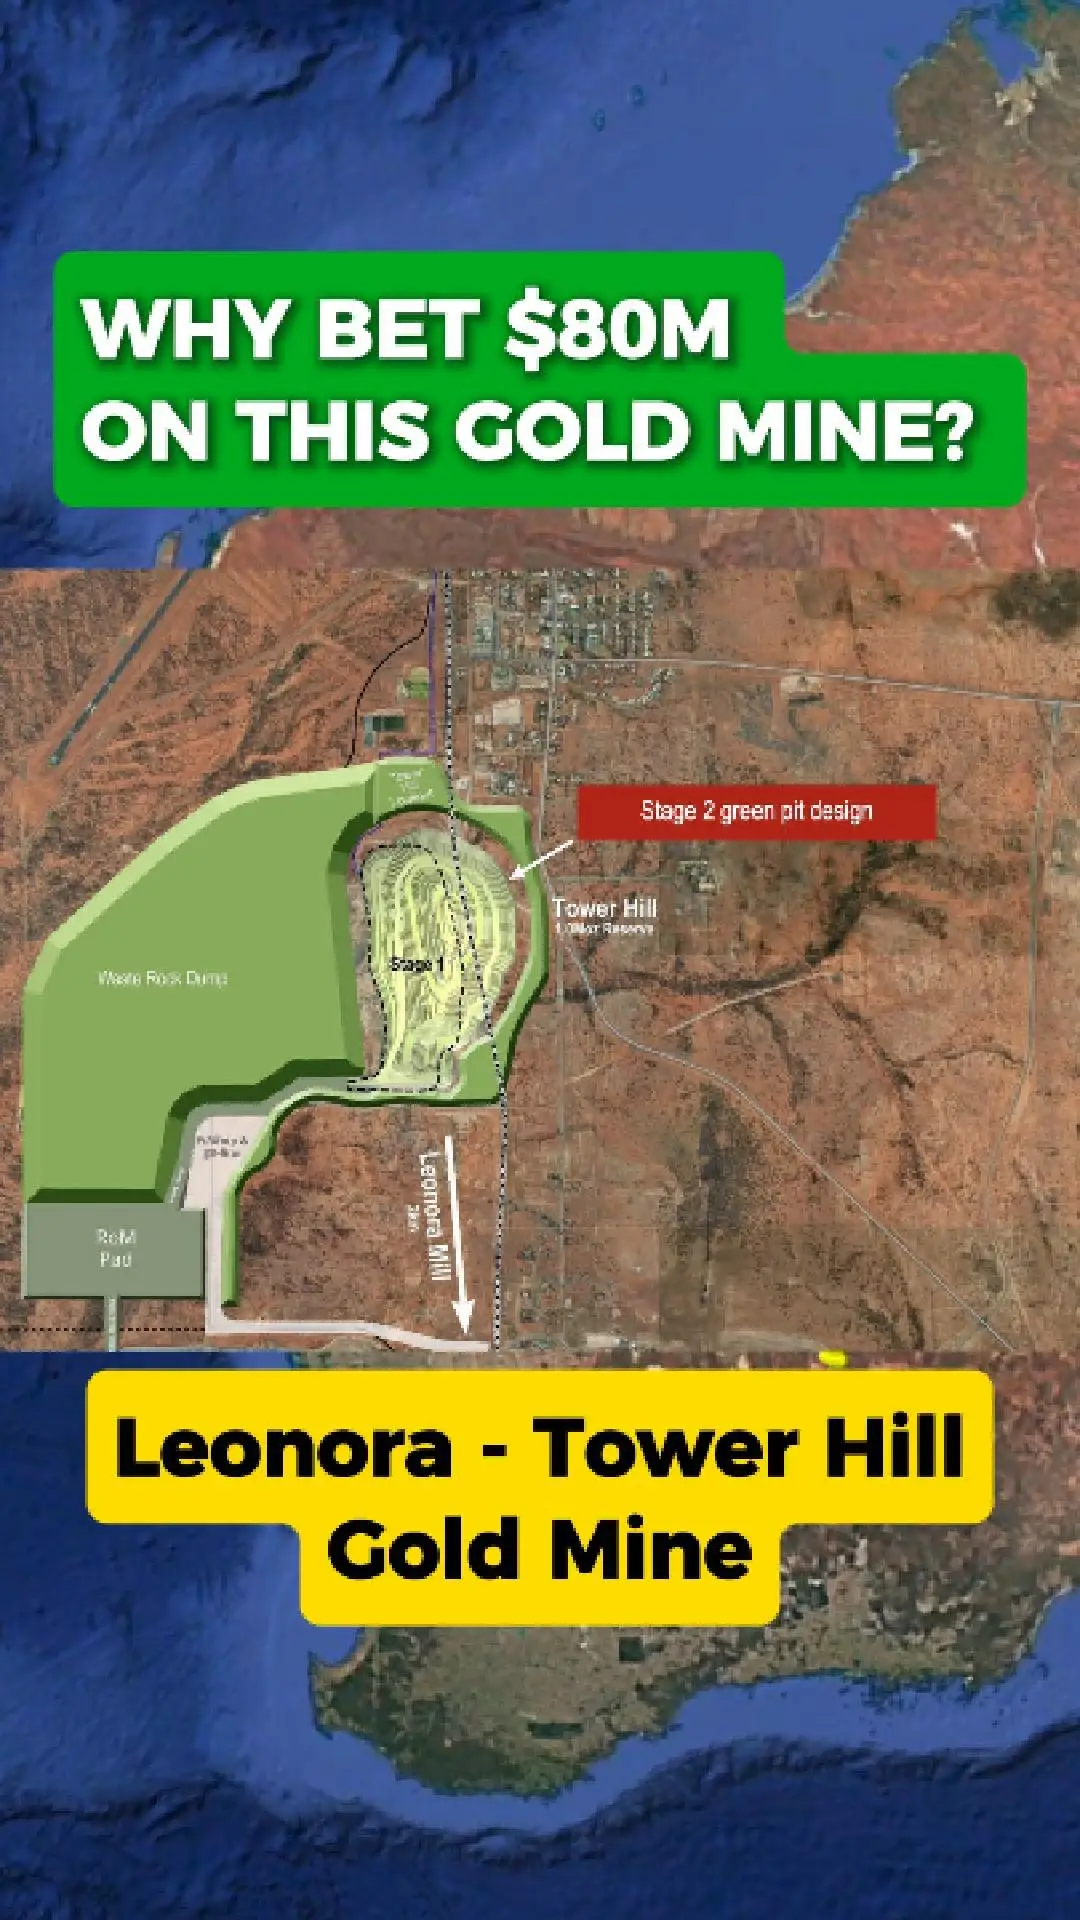
Vault Minerals Approves $80m Expansion At King Of The Hills
Vault Minerals (Asx: Vau) Has Signed Off On An $80 Million Expansion Of Its King Of The Hills (Koth) Gold Operation Near Leonora, Aiming To Lift Processing Capacity And Unlock More Of The District’S Long-Life Potential.
New Crusher And Mill Upgrades:
The Project Centres On A New Primary Crusher, New Tanks In The Cip Circuit, And Upgrades Across The Wet Plant.
A Fresh Crushing Circuit Will Be Built 110 Metres West Of The Existing One To Avoid Interrupting Current Production.
These Changes Are Designed To Reduce Bottlenecks And Support A Lift To 6 Million Tonnes Per Annum.
Tapping A Massive Stockpile:
Vault Is Currently Mill-Constrained, With A 7.3-Million-Tonne Stockpile Beside The Plant Holding More Than 108,000 Ounces Of Gold.
The Expansion Allows Faster Processing Of This Ore And Better Use Of The Company’S Multiple Feed Sources.
Strong Reserve Base:
King Of The Hills And Nearby Operations Host:
2.24moz Ore Reserves
6.02moz Mineral Resources
This Underpins A Base Case 10-Year Mine Life And Supports Future Growth Across The Leonora Region.
Construction Timeline:
Work Is Expected To Begin In April 2025, With Commissioning Targeted For Q4 Fy26.
Gr Engineering Services Completed The Design And Cost Study For The Expansion.
Positioning For Leonora’S Next Gold Wave:
With Higher Capacity, Major Infrastructure Already In Place, And Renewed Underground Exploration, Vault Minerals Sees Koth As A Key Driver For The Next Phase Of Growth In The Leonora Gold District.
Cover Image: Data Sio, Noaa, U.S. Navy, Nga, Gebco. Image Landsat / Copernicus.
Processing Plant Image: © Vault Minerals.