LykeShares
Chat Trending Shares
Sign up
Login
Sign Up
(current)
Top 10 Trends
Watchlist
Feedback
Advertise With Us
Profile
Home
Search
Top 10 Trends
Watchlist
Advertise
Feedback
Profile
SATURN METALS LIMITED Chat
+
Link
Image
Poll
C
Lykeshares
2y
Official
$STN
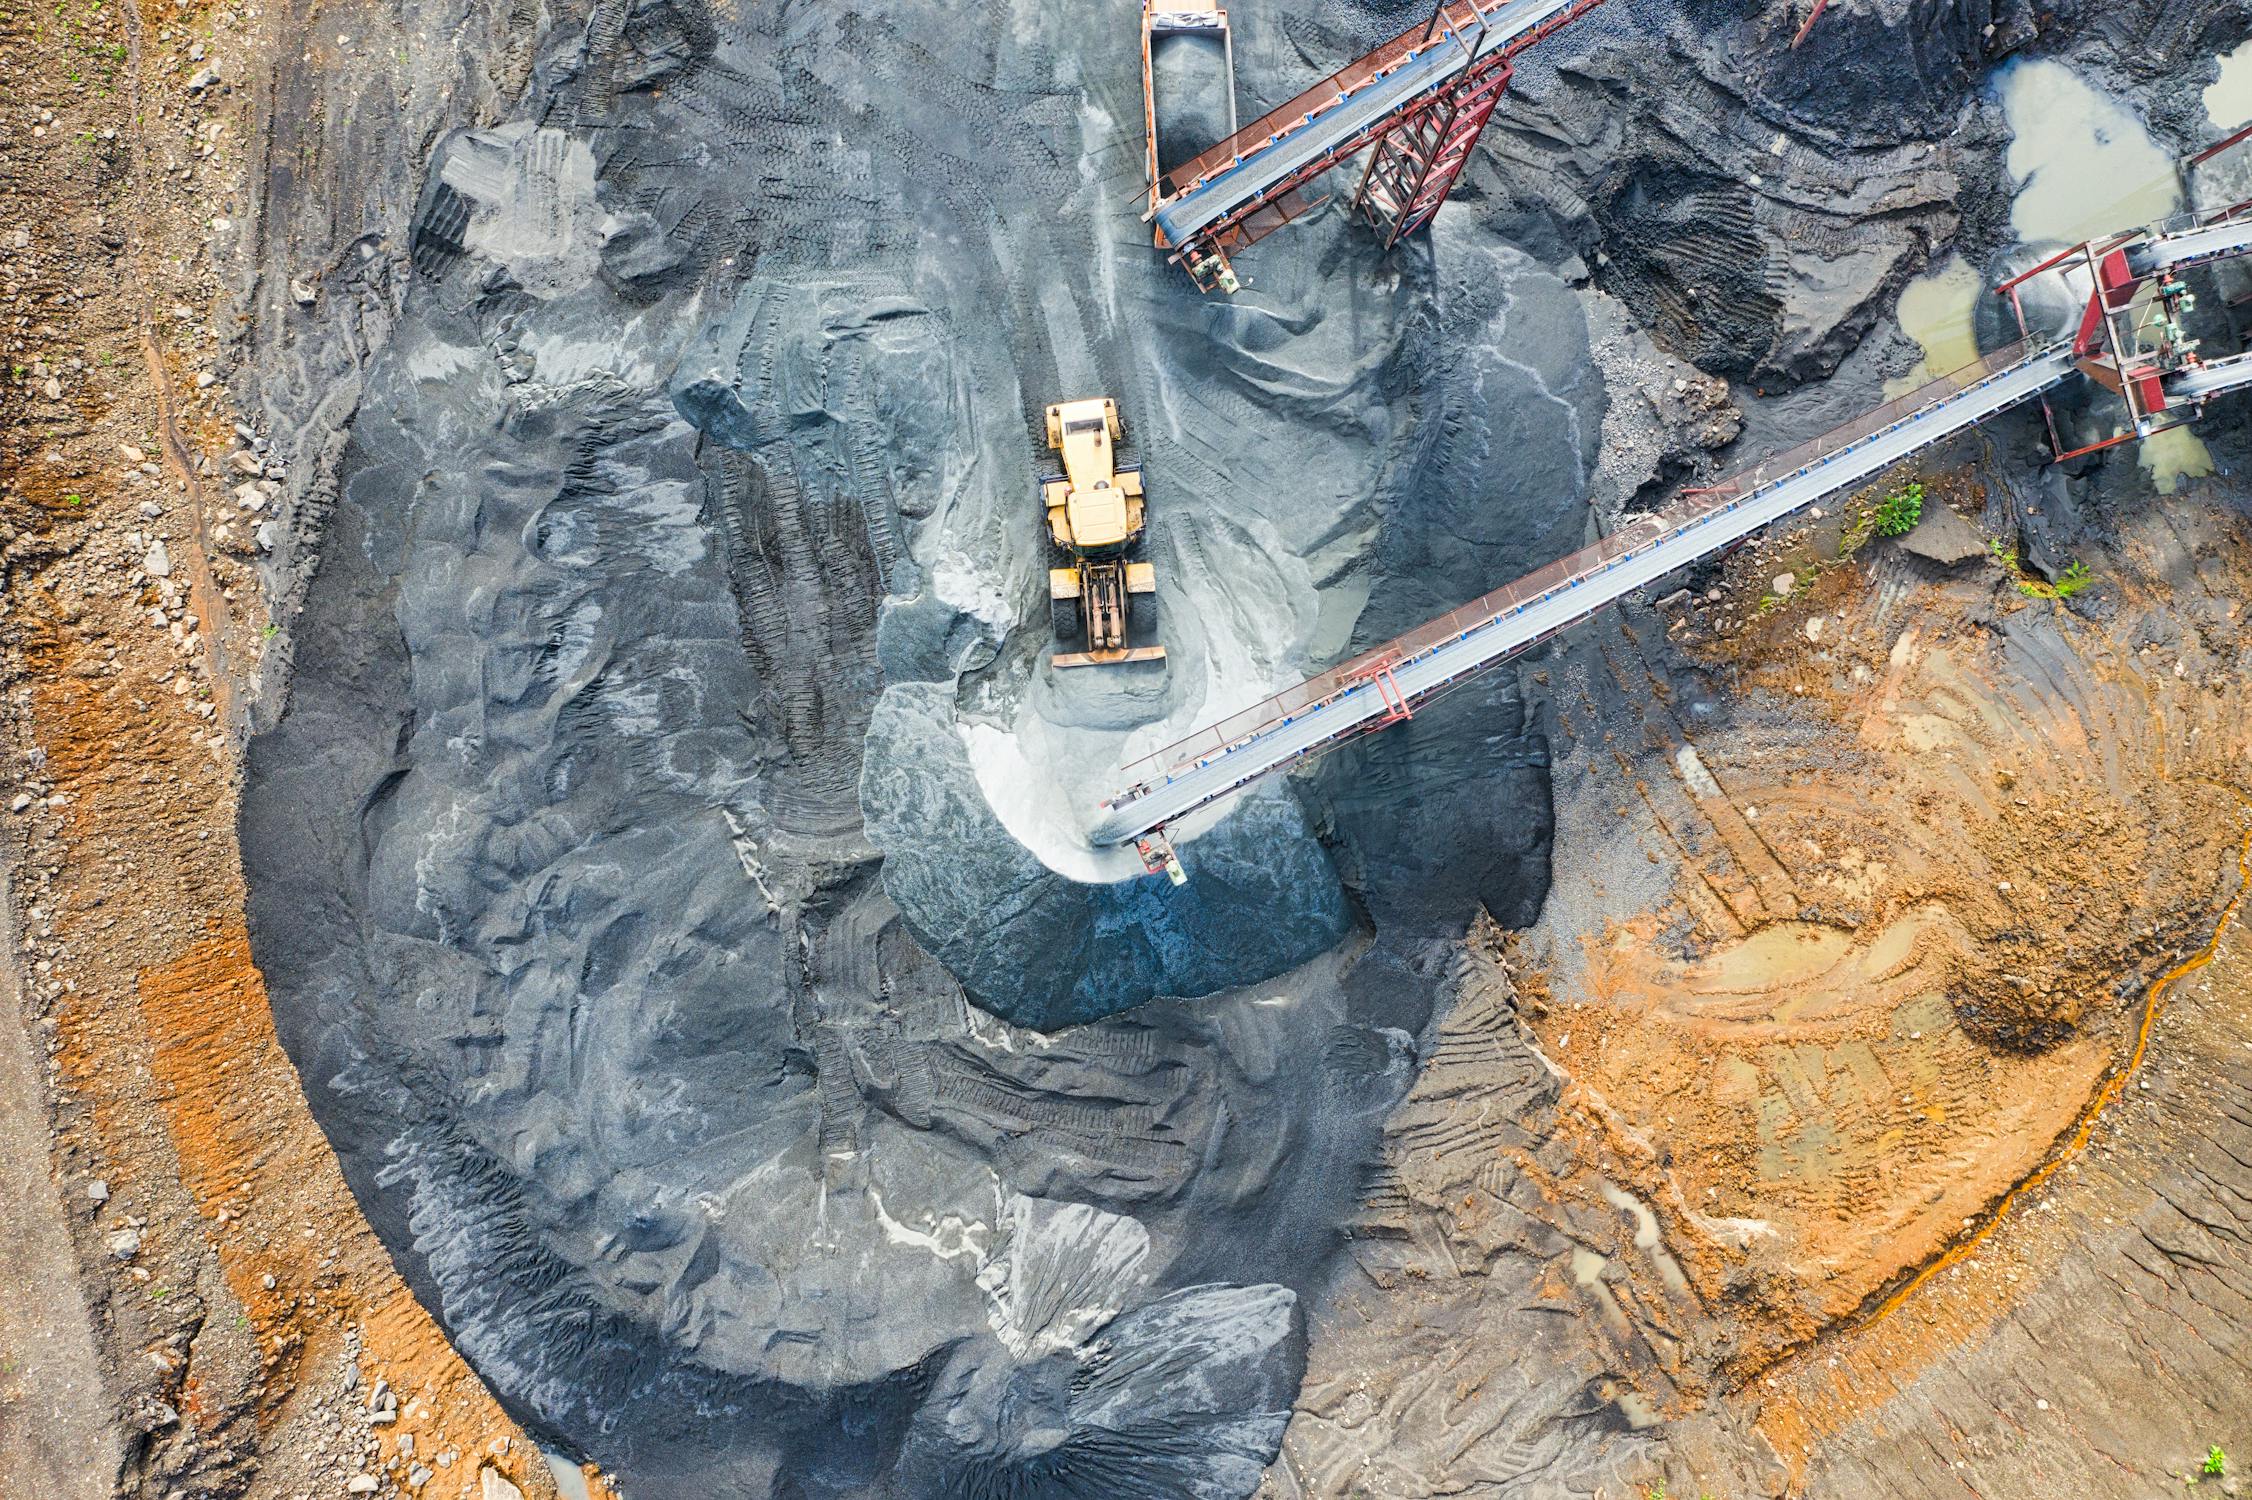
Saturn Metals Reports Excellent Metallurgical Results for Low-Cost, Heap Leach Gold Processing at Apollo Hill
275 Views
0 Likes
Reply
Loading…
ASX:STN — Live Chart, Financials & Chat | SATURN METALS LIMITED
S
Saturn Metals Limited
ASX:STN
Australia
Materials
Add to Watchlist
by TradingView