
S Syrah Resources Limited
ASX:SYR
Australia
1.4k
How Does Syrah Resources' Vidalia Facility Contribute To The U.S. Battery Supply Chain?
 ASX:SYR
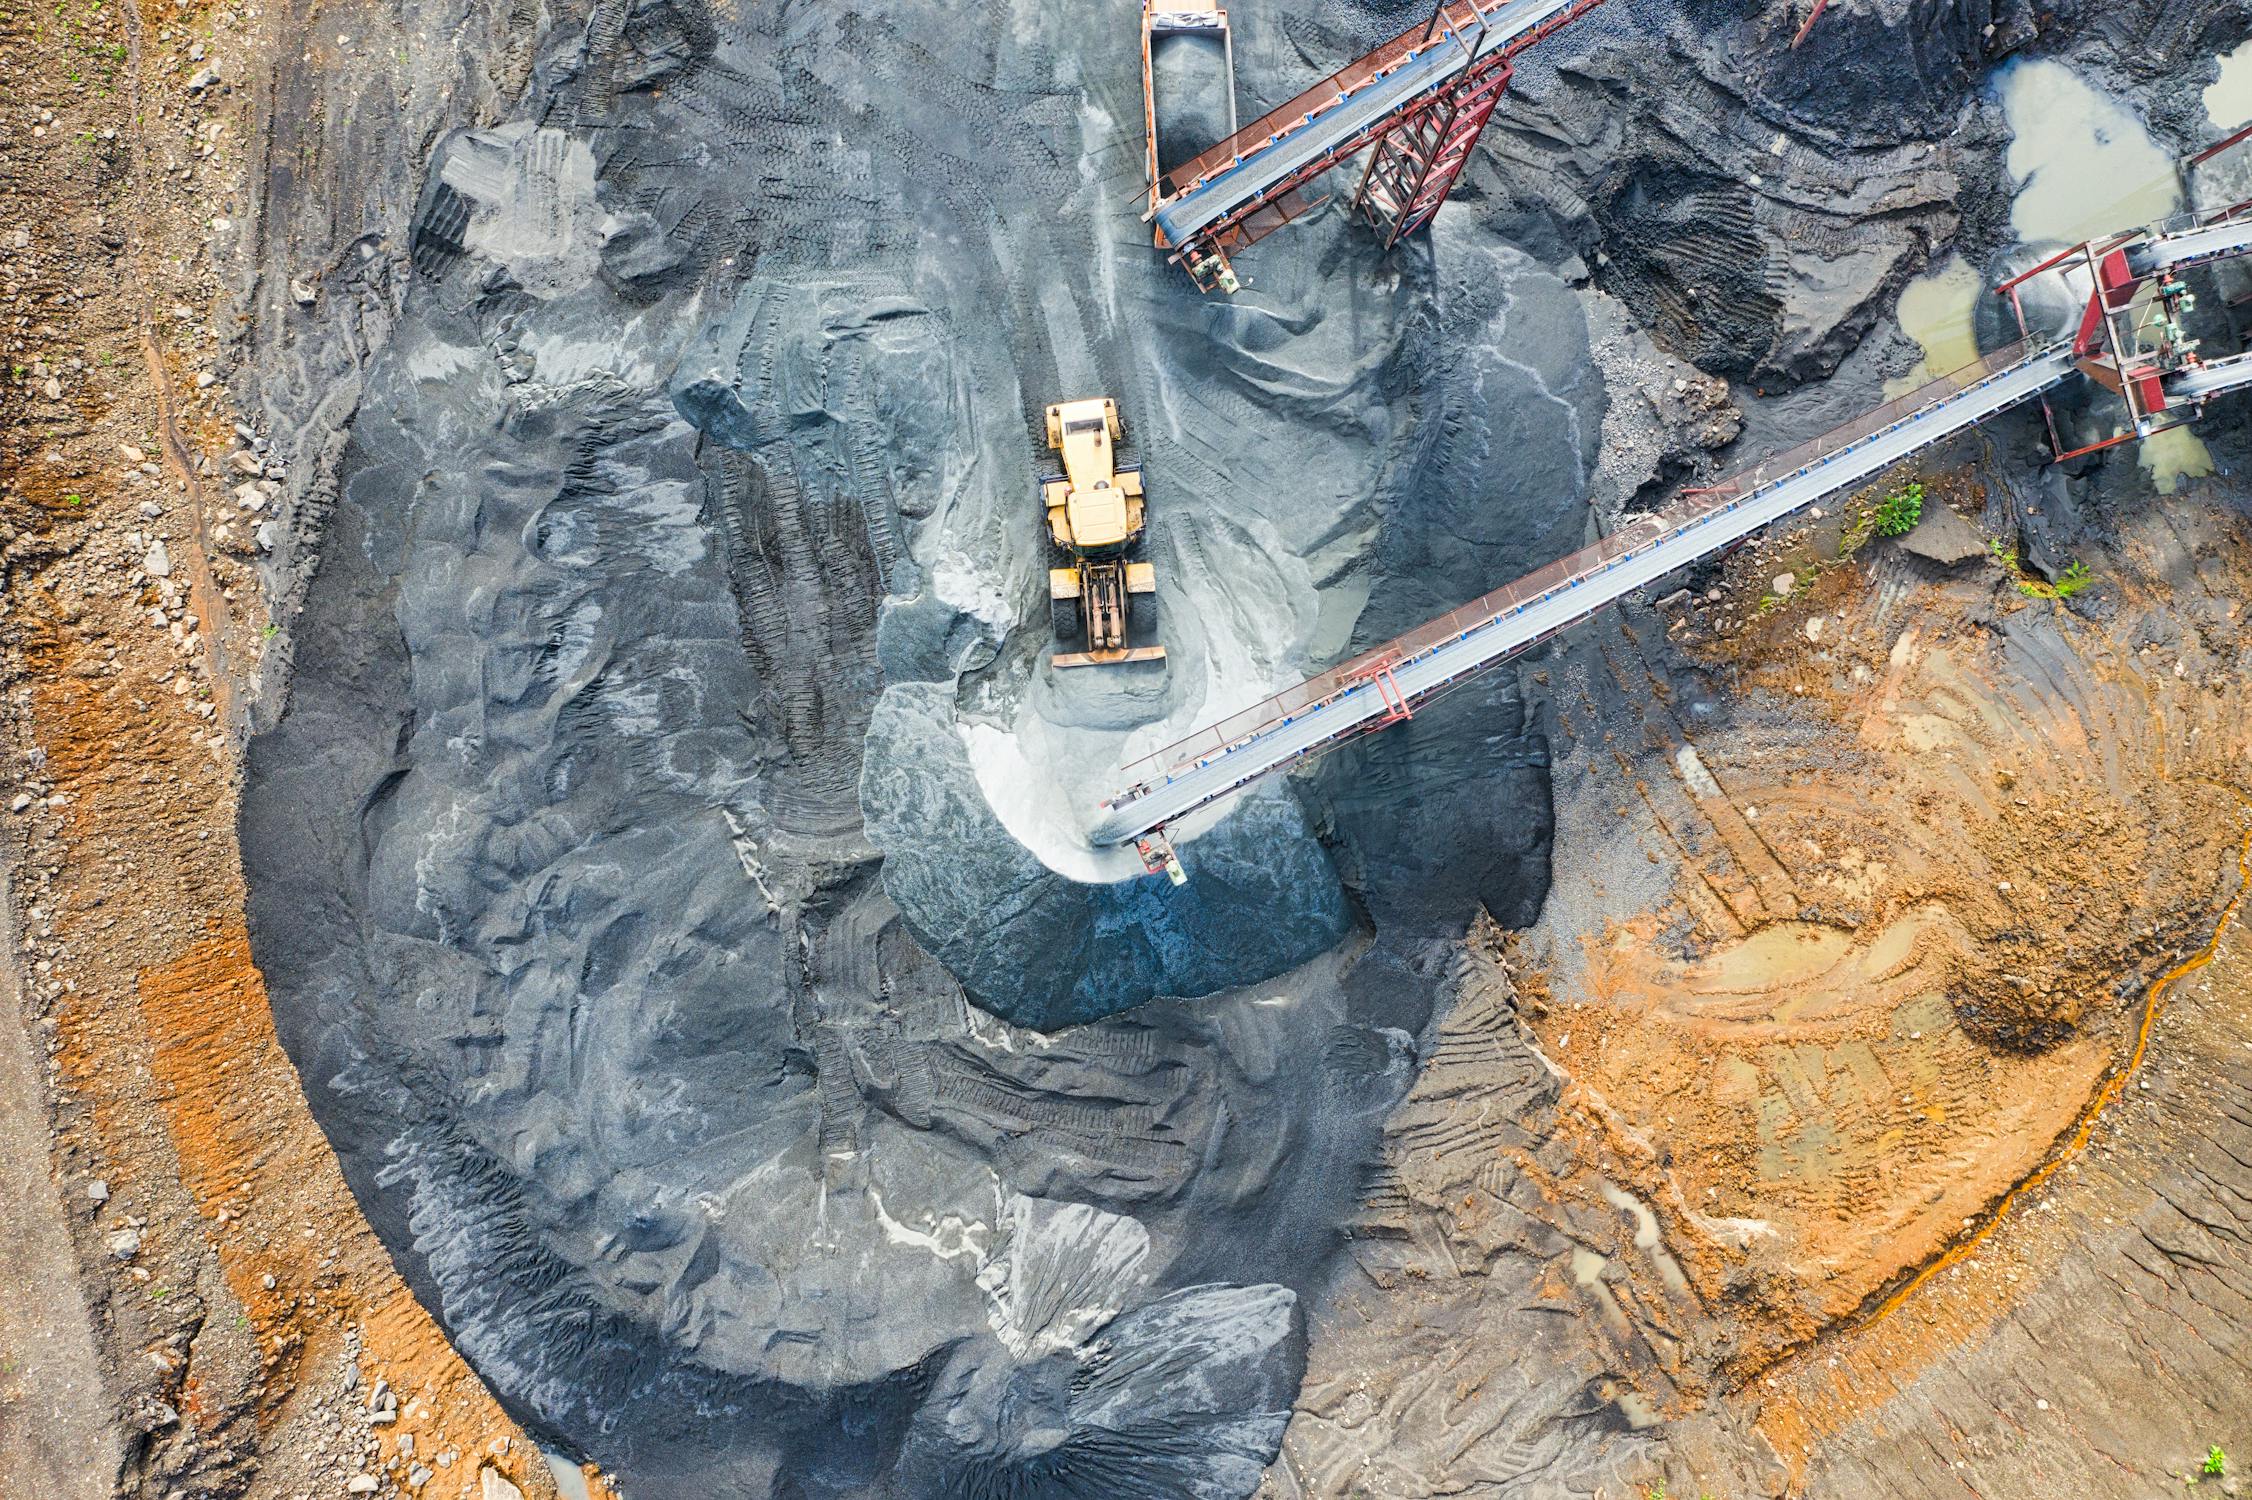
What Are The Latest Production Figures From Syrah Resources' Balama Graphite Operation?
ASX:SYR

Who Is Stephen Wells? Chief Financial Officer Of Syrah Resources
ASX:SYR
How Much Of Syrah Resources Do The Directors Own?
ASX:SYR
How Has Syrah Resources Prepared For The Production Of Active Anode Material (Aam)?
ASX:SYR

Deep Dive On Syrah Resources: Company Strategy And Projects Going Forward
ASX:SYR

Popular Stocks 🚀
Show more