

$WA1
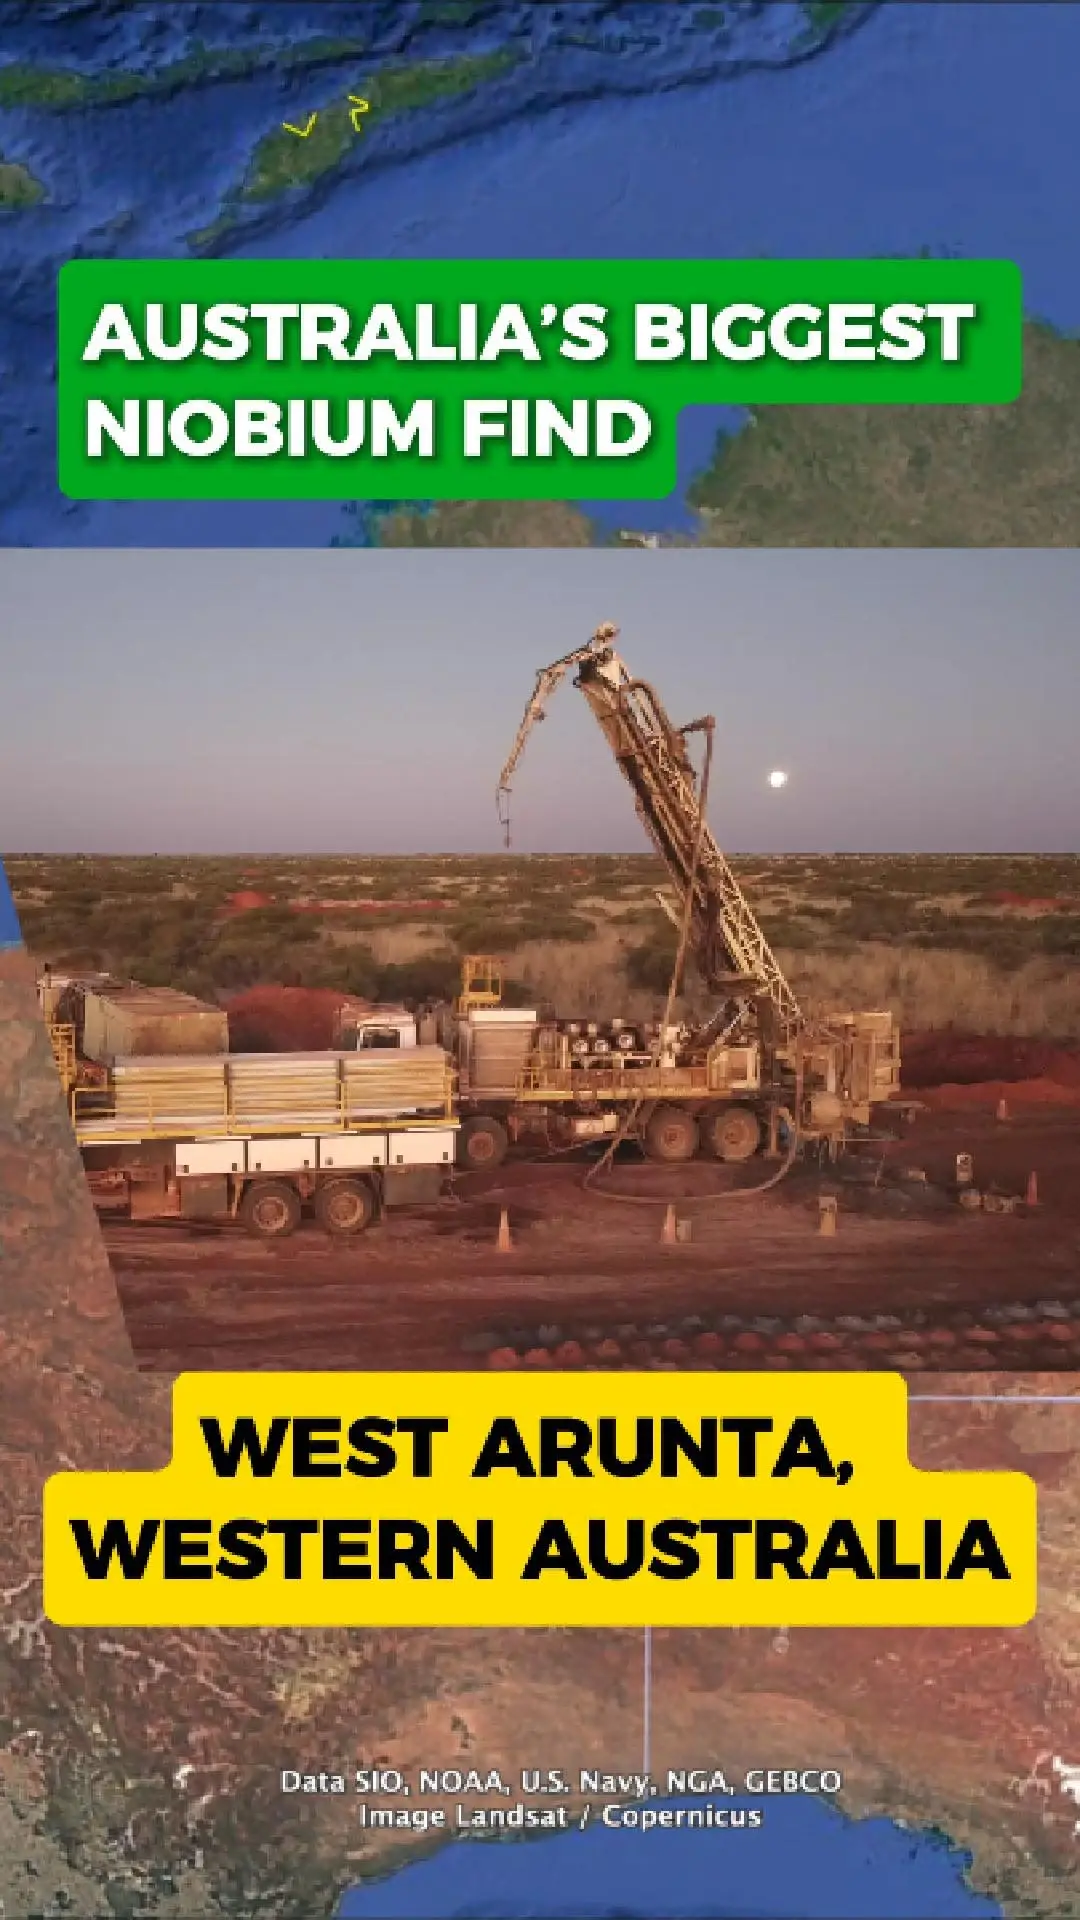
Australia Fast-Tracks Major Niobium Discovery
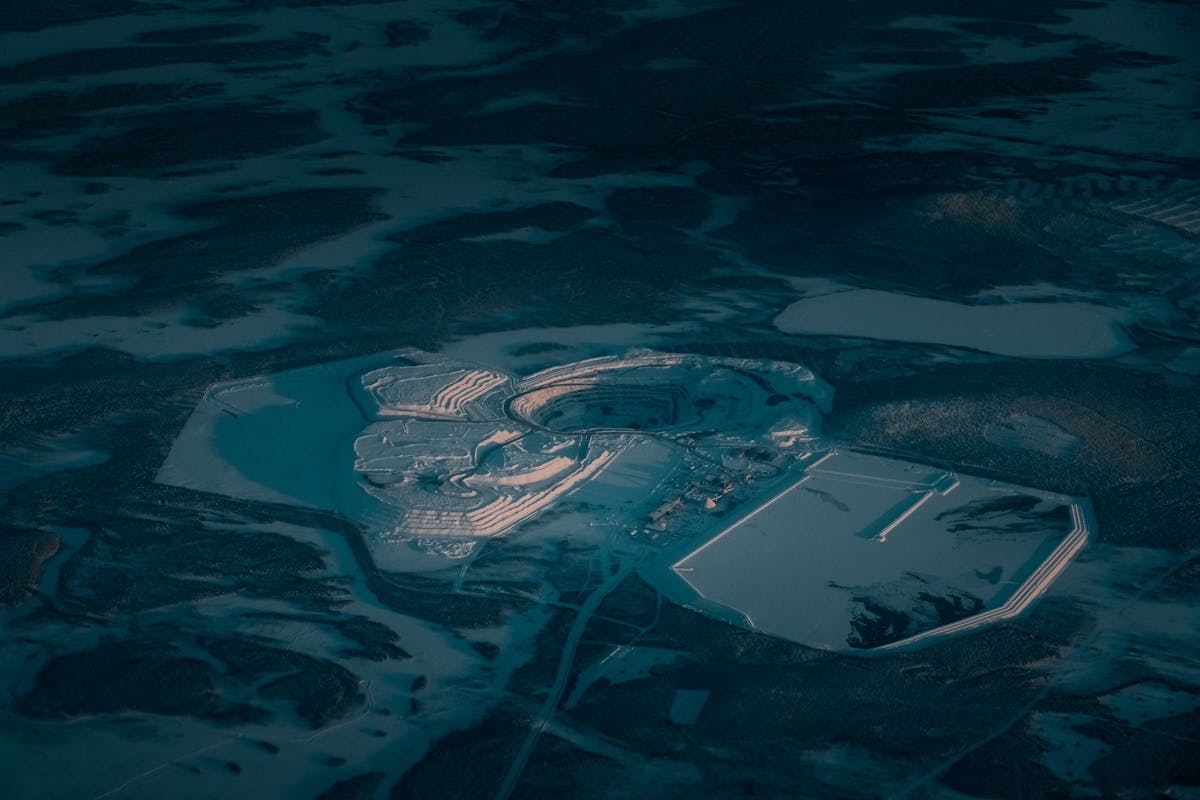
One of the world’s most significant niobium discoveries is now being pushed forward in remote Western Australia, after the Federal Government granted major project status to WA1 Resources’ Luni project.
Located in the West Arunta region, the project contains over 200 million tonnes of high-grade niobium- and ...