W West Wits Mining Limited
ASX:WWI
Australia
434
West Wits Mining Secures Zar300 Million For Qala Shallows Project In South Africa
 ASX:WWI
West Wits Mining Receives Expression Of Interest From Idc For Qala Shallows Project Funding
ASX:WWI
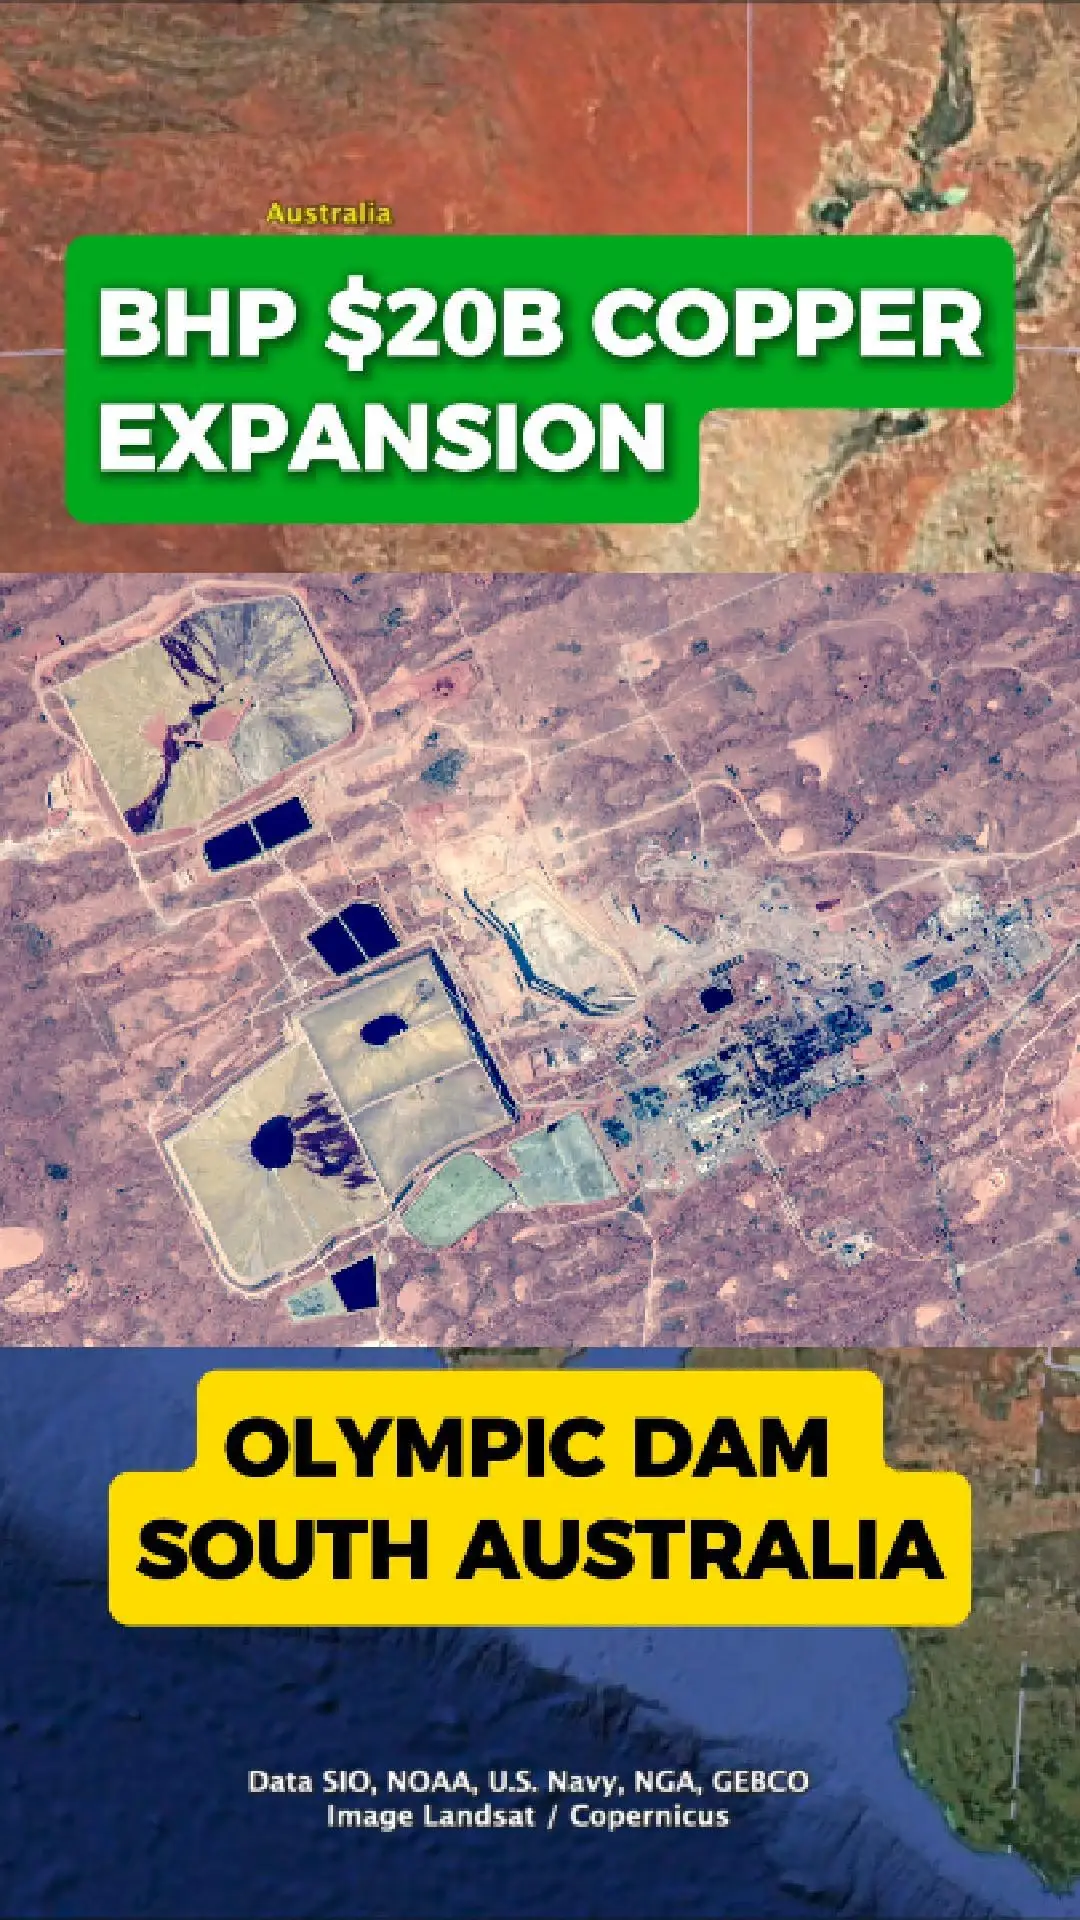
Bhp Weighs $20 Billion Copper Expansion In South Australia
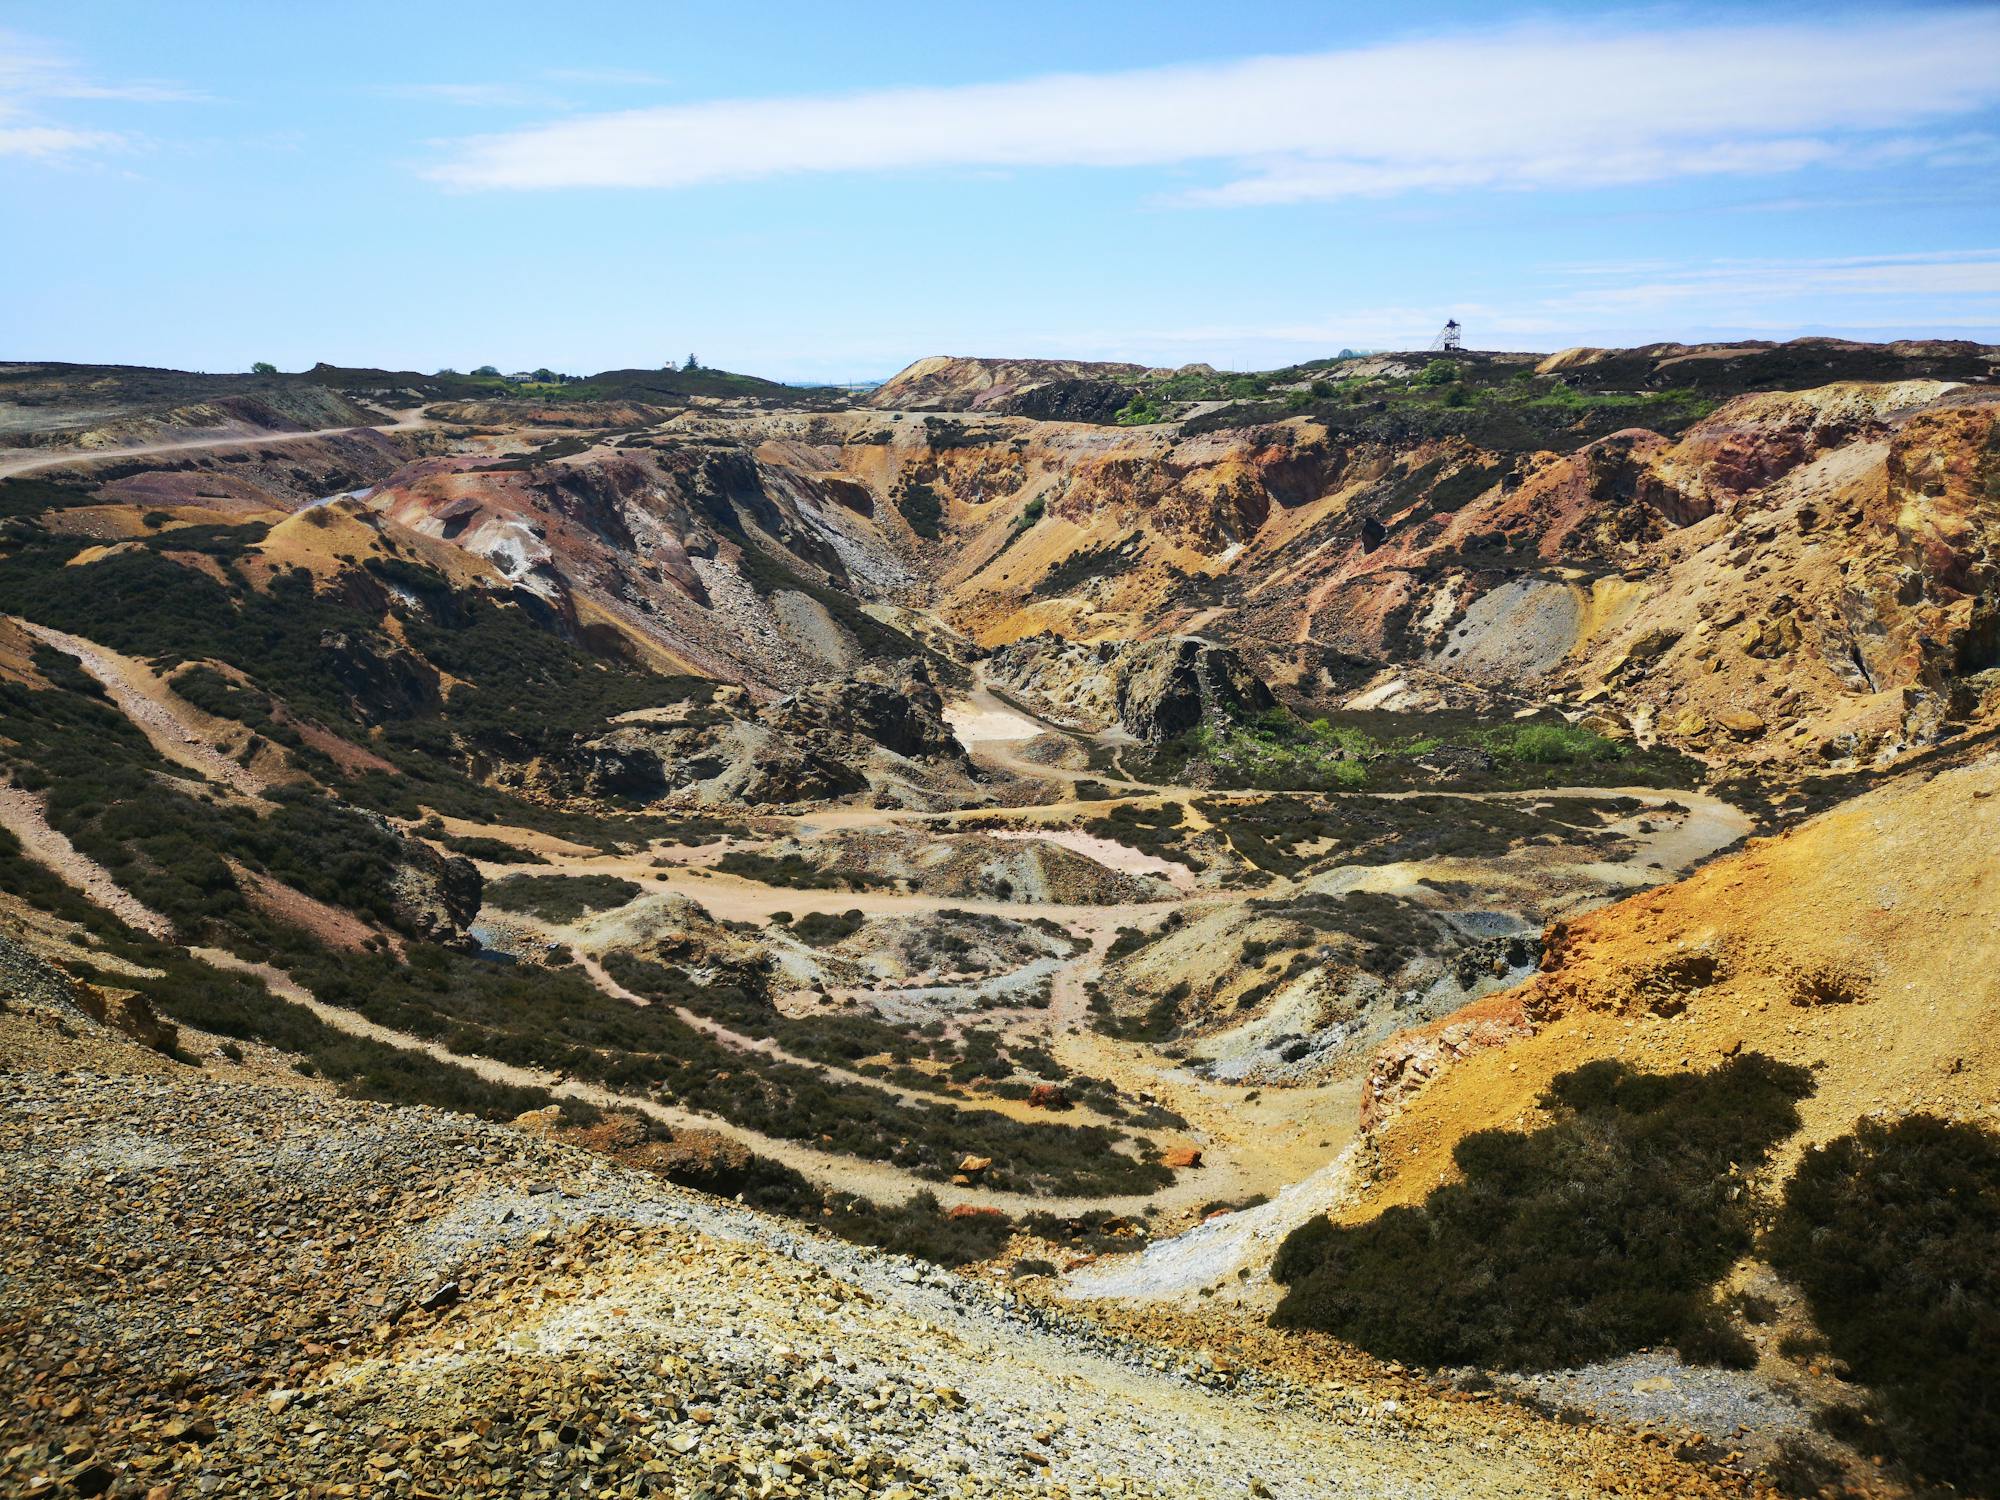
Around 500 Kilometres North Of Adelaide Sits Olympic Dam, One Of The World’S Largest And Most Valuable Copper Deposits. It’S A Long-Running Operation In The Heart Of South Australia’S Outback, And A Critical Asset In Global Copper Supply.
Linking Olympic Dam With Oak Dam
Bhp’S Latest Studies Investigate Connecting Olympic Dam With Oak Dam — A High-Grade Copper Discovery Located Nearby. If Developed Together, The Two Sites Could Form A New Copper Hub Capable Of Lifting South Australia’S Production For Decades.
A Project Facing Big Challenges
Despite The Scale Of The Opportunity, Several Challenges Are Slowing Progress. Rising Energy Costs, Limited Water Availability, And Ongoing Infrastructure Constraints All Add Complexity To The Project. Water Supply In Particular Remains A Key Issue In The Region, With Any Major Expansion Likely Requiring New Pipelines Or Desalination Investment.
Could This Be Australia’S Next Pilbara?
If Bhp Overcomes These Hurdles, South Australia Could Become Home To A Copper Province On The Scale Of The Pilbara’S Iron Ore Industry. With Global Demand For Copper Surging, The Region’S Long-Term Potential Is Significant — But Turning It Into Australia’S Next Major Mining Hub Will Depend On Solving Today’S Bottlenecks.
ASX:BHP
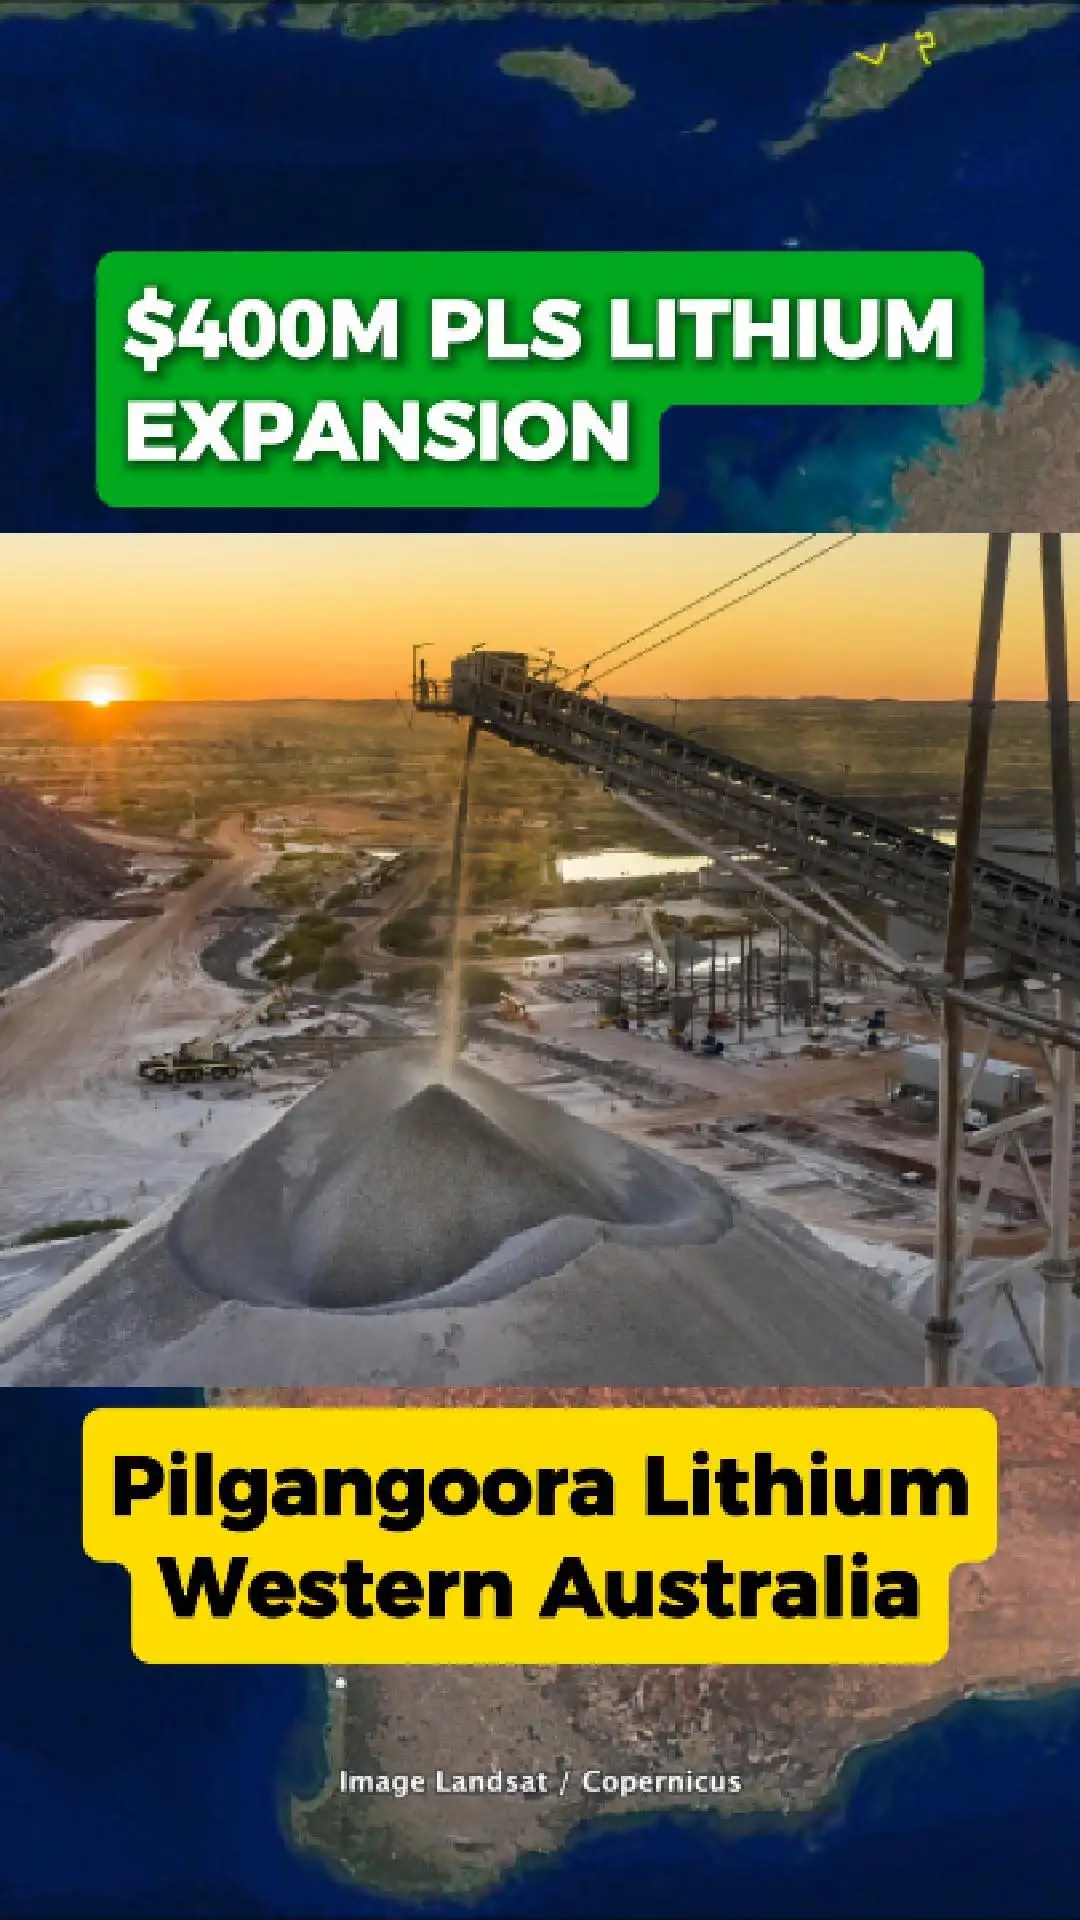
Pilbara Minerals’ $400m Lithium Expansion: One Year On
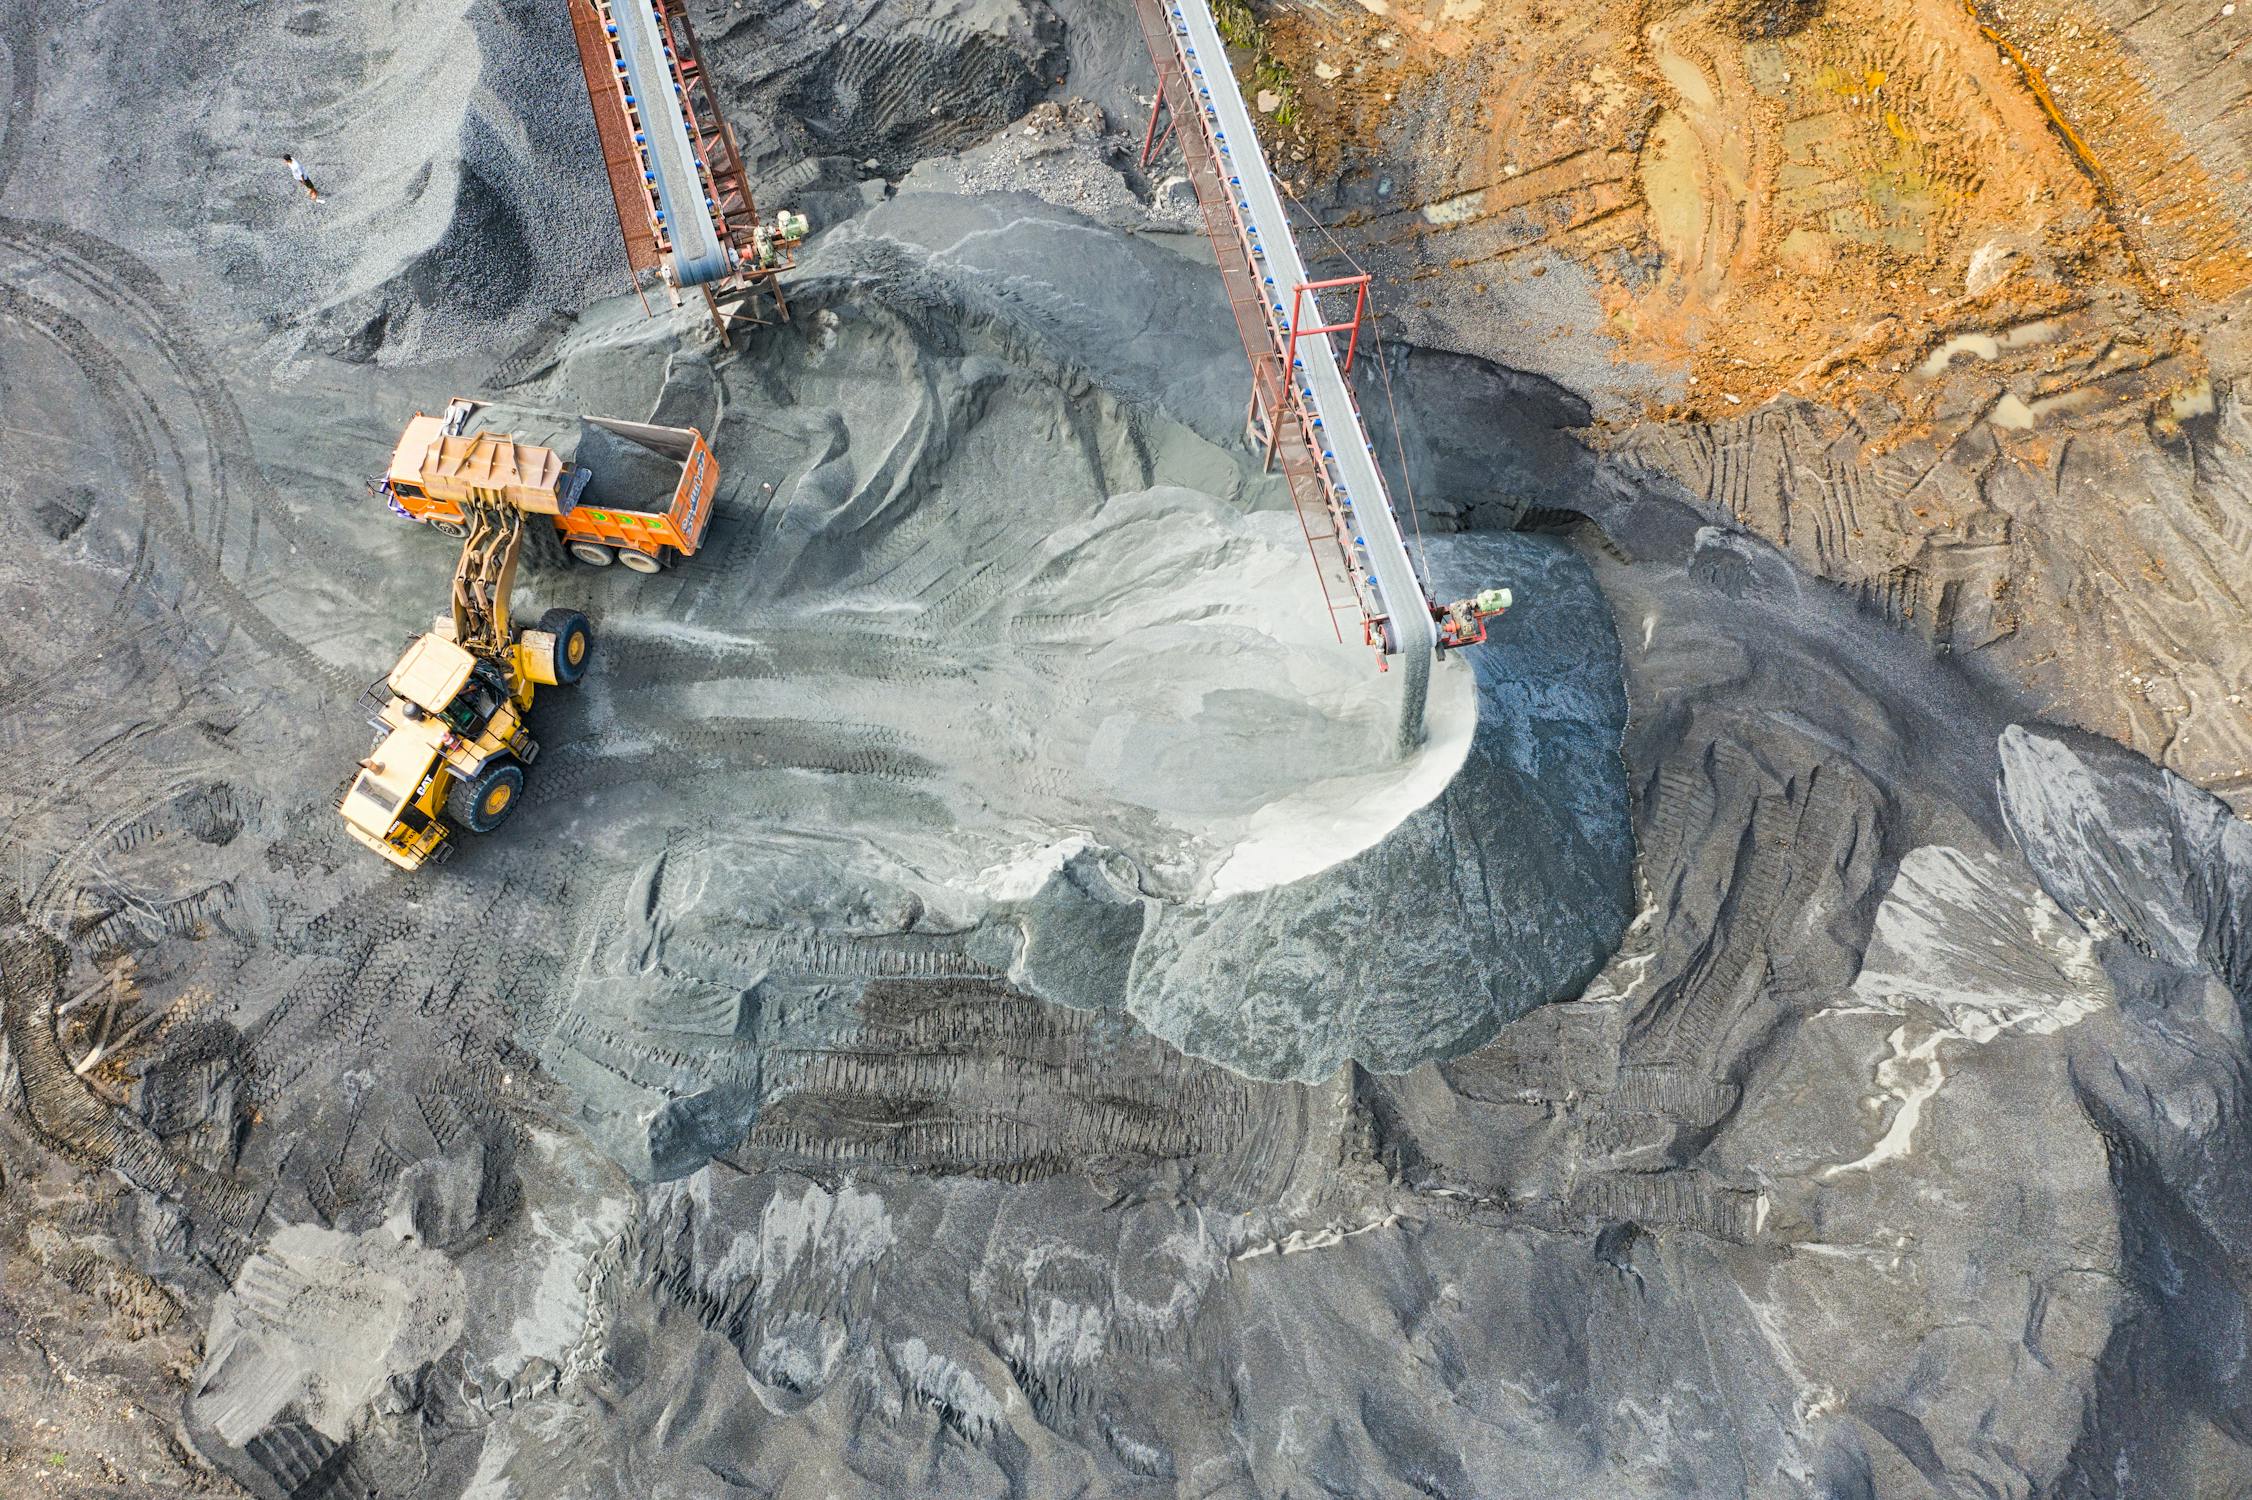
Pilbara Minerals Has Now Passed The One-Year Mark Since Completing Its $404 Million P680 Expansion At The Pilgangoora Lithium Mine In Western Australia. The Project Delivered A Huge Boost To Site Capacity, Including The Installation Of The World’S Largest Lithium Ore Sorter And A Brand-New Crushing Facility.
What The Upgrade Was Designed To Do
The P680 Expansion Was Built To Lift Production By Around 30%, Improve Ore Recovery, And Reduce Waste. It Also Forms A Key Step In Pilbara Minerals’ Longer-Term Plan To Grow Pilgangoora Toward A 1 Million Tonne Per Annum Operation Through Future Expansions.
Government Support And Jobs
The Project Was Backed By $250 Million In Government Loans Through Export Finance Australia And The Northern Australia Infrastructure Facility. Construction Created More Than 350 Jobs, With Ongoing Roles Added As The Mine’S Capacity Increased.
A Year Later — Is It Paying Off?
With Lithium Markets Shifting Rapidly Over The Past 12 Months, Many Investors Are Asking Whether This Major Upgrade Is Delivering The Results Pilbara Minerals Expected. Early Signs Suggest Improved Throughput, Stronger Operational Efficiency, And A Foundation For Future Growth — But The Company’S Long-Term Performance Will Depend On Market Conditions And The Planned Transition Toward The Larger P1000 Expansion.
A Critical Asset For Wa’S Lithium Future
What’S Clear Is That Pilgangoora Remains One Of The World’S Most Significant Hard-Rock Lithium Operations. The P680 Upgrade Has Strengthened Its Position And Given Pilbara Minerals More Flexibility As Global Demand For Battery Minerals Evolves.
ASX:PLS
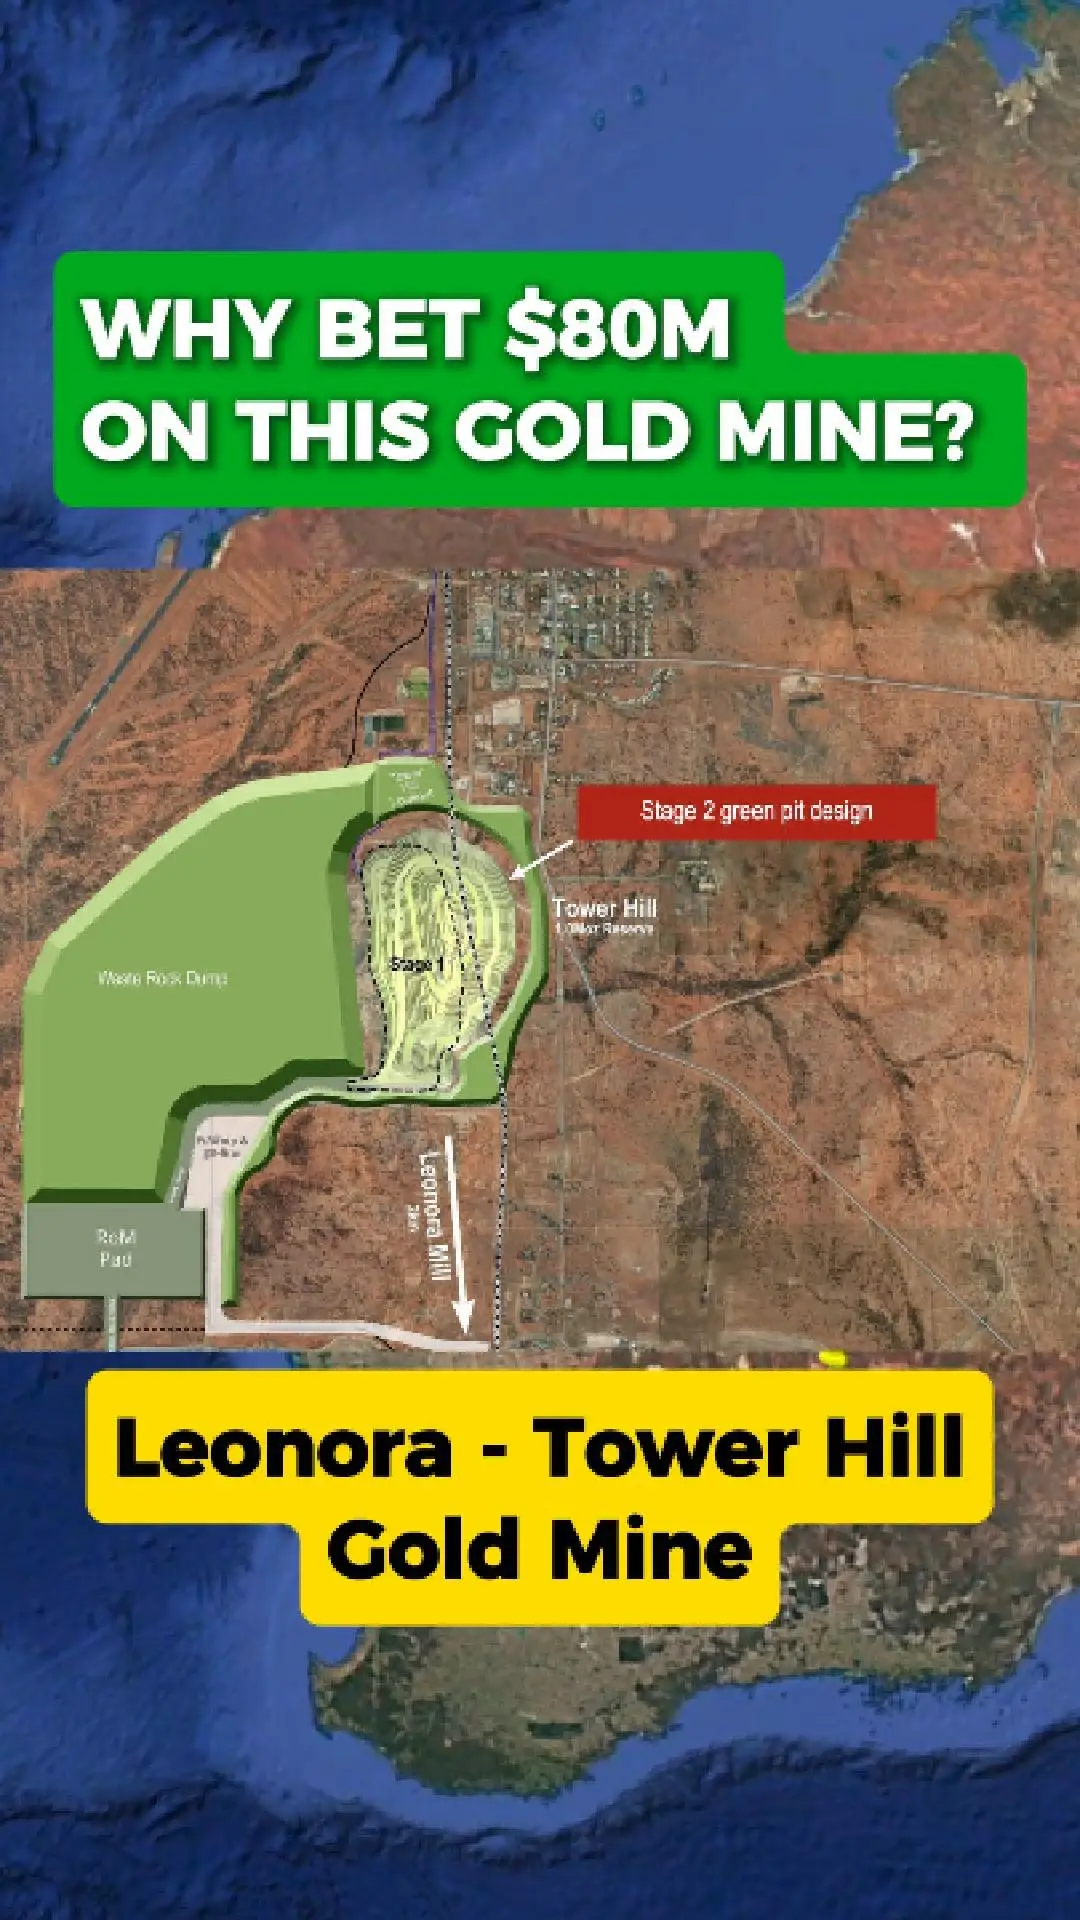
Why Bet $80 Million On This Gold Mine?
Genesis Minerals Is Accelerating Work At Tower Hill — A Major Gold Deposit Just Outside Leonora In Western Australia — As The Company Moves Closer To Full-Scale Development. With Gold Prices Trading Near Record Highs, The Project Has Quickly Become One Of Wa’S Most-Watched Growth Stories.
Shifting The Rail To Unlock The Pit
One Of The Most Significant Steps Is The Plan To Relocate The Nearby Rail Line. This Allows Genesis To Expand The Mill And Open Up The Full Extent Of The Tower Hill Pit — Something Previous Owners Couldn’T Realistically Do. The Move Clears The Way For A Larger, More Efficient Operation Tied Directly Into Genesis’ Leonora Production Hub.
High-Grade Hits Continue
Recent Drilling Around Tower Hill Has Returned Consistent High-Grade Intercepts, Strengthening Confidence In The Resource And Supporting Plans For A Much Larger Mine Footprint. These Results Also Feed Into An Expanded Underground Study Now Underway.
A New Gold Hub In The Making?
With Planned Capital Spending Around The $80 Million Mark, A Strong Gold Market, And A District-Scale Strategy Connecting Multiple Deposits, Investors Are Watching Closely. If The Development Plan Lands As Expected, Tower Hill Could Become Wa’S Next Major Gold Success Story — And A Key Pillar In Genesis Minerals’ Leonora Growth Plans.
ASX:GMD
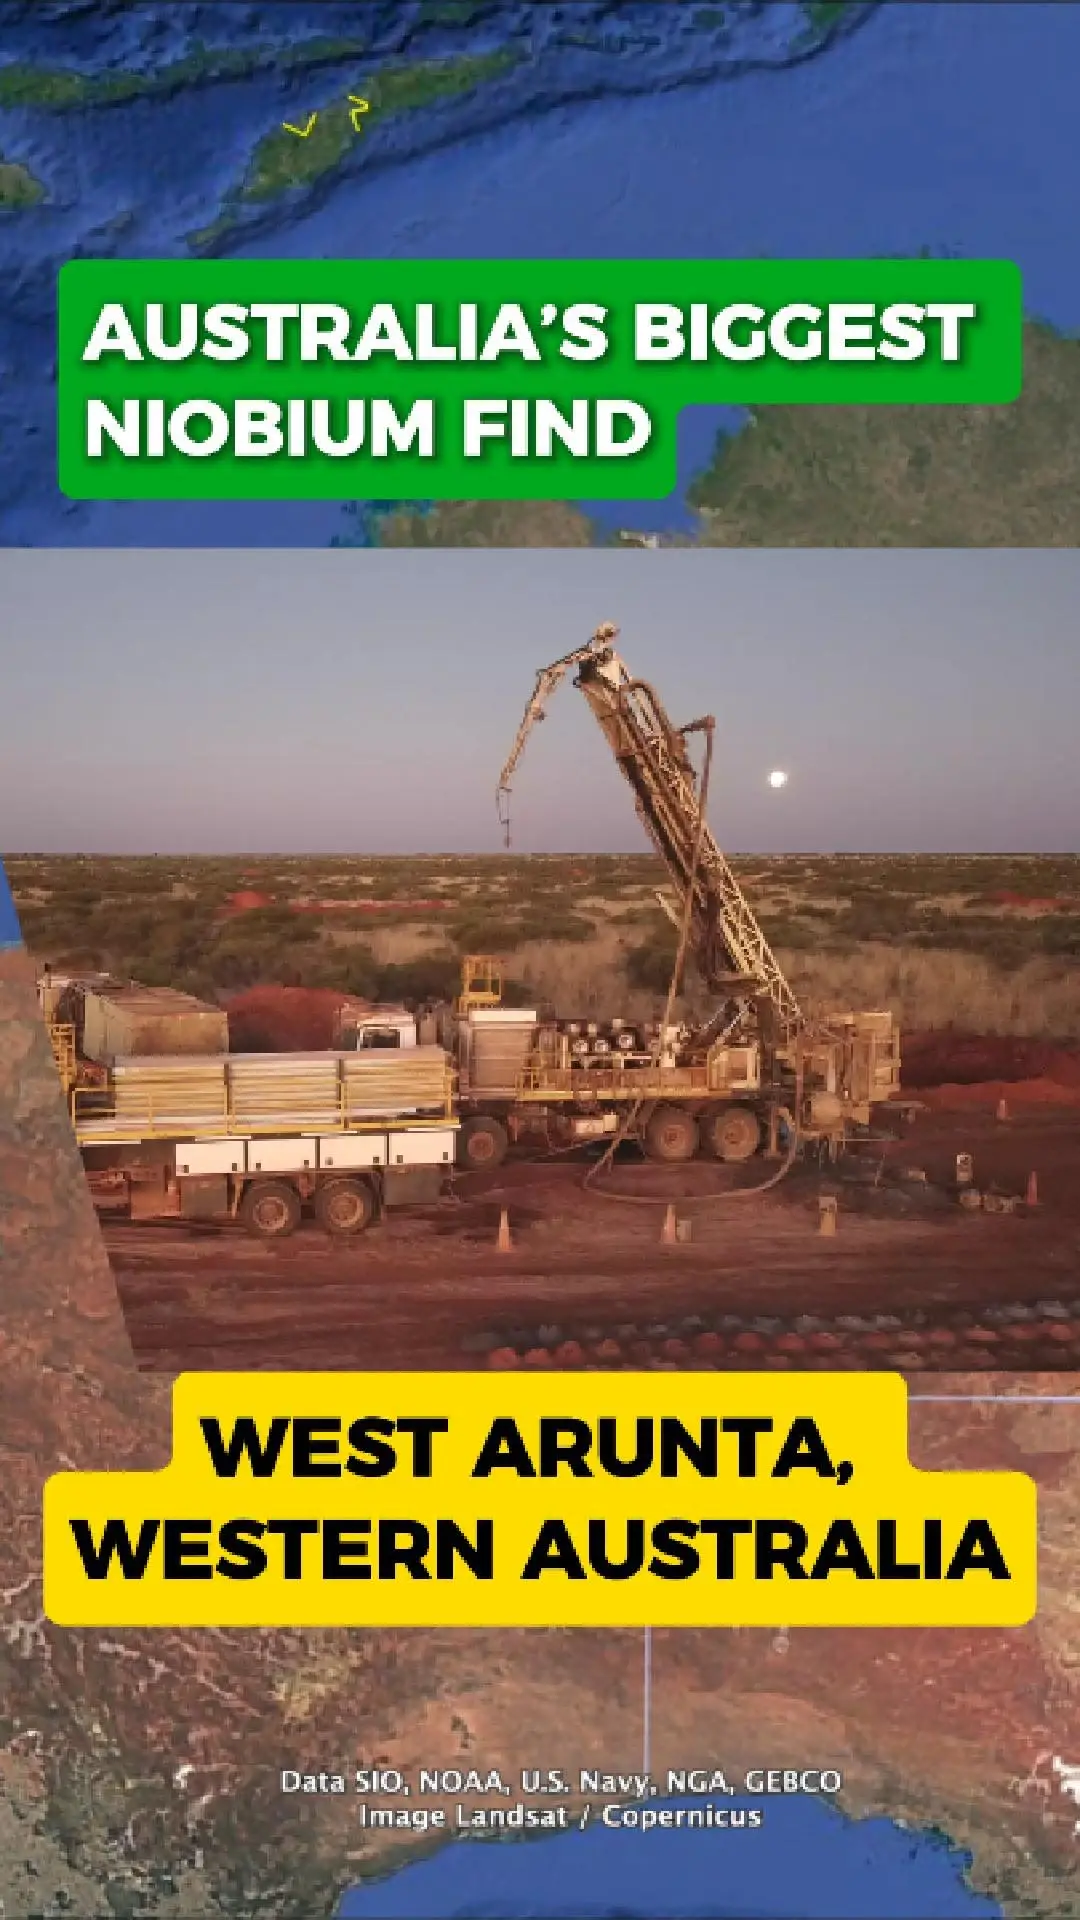
Australia Fast-Tracks Major Niobium Discovery
One Of The World’S Most Significant Niobium Discoveries Is Now Being Pushed Forward In Remote Western Australia, After The Federal Government Granted Major Project Status To Wa1 Resources’ Luni Project.
Located In The West Arunta Region, The Project Contains Over 200 Million Tonnes Of High-Grade Niobium- And Phosphorus-Rich Material — Described By Wa1 As The Biggest Niobium Discovery In 70 Years.
Why Niobium Matters
Niobium Is A Strategic Critical Mineral Used To Strengthen High-Performance Steel, Particularly In Pipelines, Automotive Components And Major Construction.
It Is Also Essential In Jet Engine Superalloys, Superconducting Magnets, Electronics, And Other Advanced Technologies.
The Scale Of Luni Gives Australia A Rare Opportunity To Expand Its Role In The Global Supply Of This Specialised Metal, Which Is Currently Dominated By Brazil.
A Key Step In Strengthening Supply Chains
The Major Project Status Designation Signals Canberra’S View Of Luni As A Development With National Economic And Strategic Importance.
Wa1 Says The Recognition Highlights Luni’S Potential To Support Regional Jobs, Bolster Sovereign Capability, And Contribute To Australia’S Growing Critical-Minerals Export Sector.
As Studies Progress, Luni Is Shaping Up As One Of The Country’S Most Important New Mineral Projects — And A Rare Moment Of Global Significance For The Niobium Industry.
ASX:WA1
Popular Stocks 🚀
Show more