MЕGA DARKNЕT- Все Официальные Ссылки и Актуальные Зеркала — 2025!
ZEOTECH LIMITED Chat

@LykeShares Australia can be competitive — our raw costs are close to China’s, it’s their subsidies that distort the market.
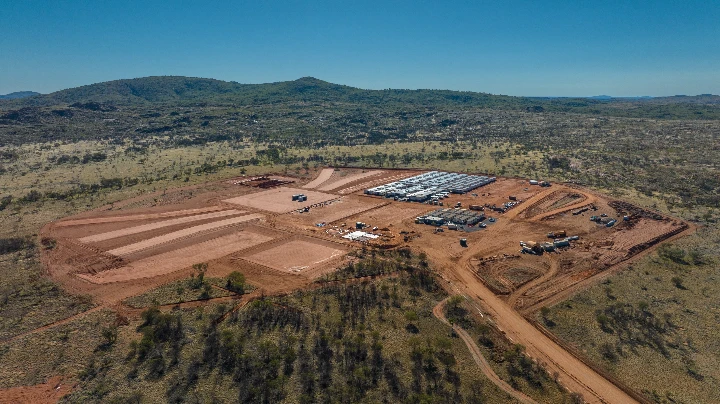
Z Zeotech Limited
ASX:ZEO
Australia
Revenue: 976.5k
$0.0/sec