
Z Zip Co Limited..
ASX:ZIP
Australia
485
Why Is Zip Co Limited Making Significant Improvement In Cash Ebtda?
 ASX:ZIP

Zip Improves Margins And Strengthens Balance Sheet
ASX:ZIP

Zip Co Launches Zip Business, Offering Small And Medium-Sized Businesses Flexible Credit Solutions
ASX:ZIP
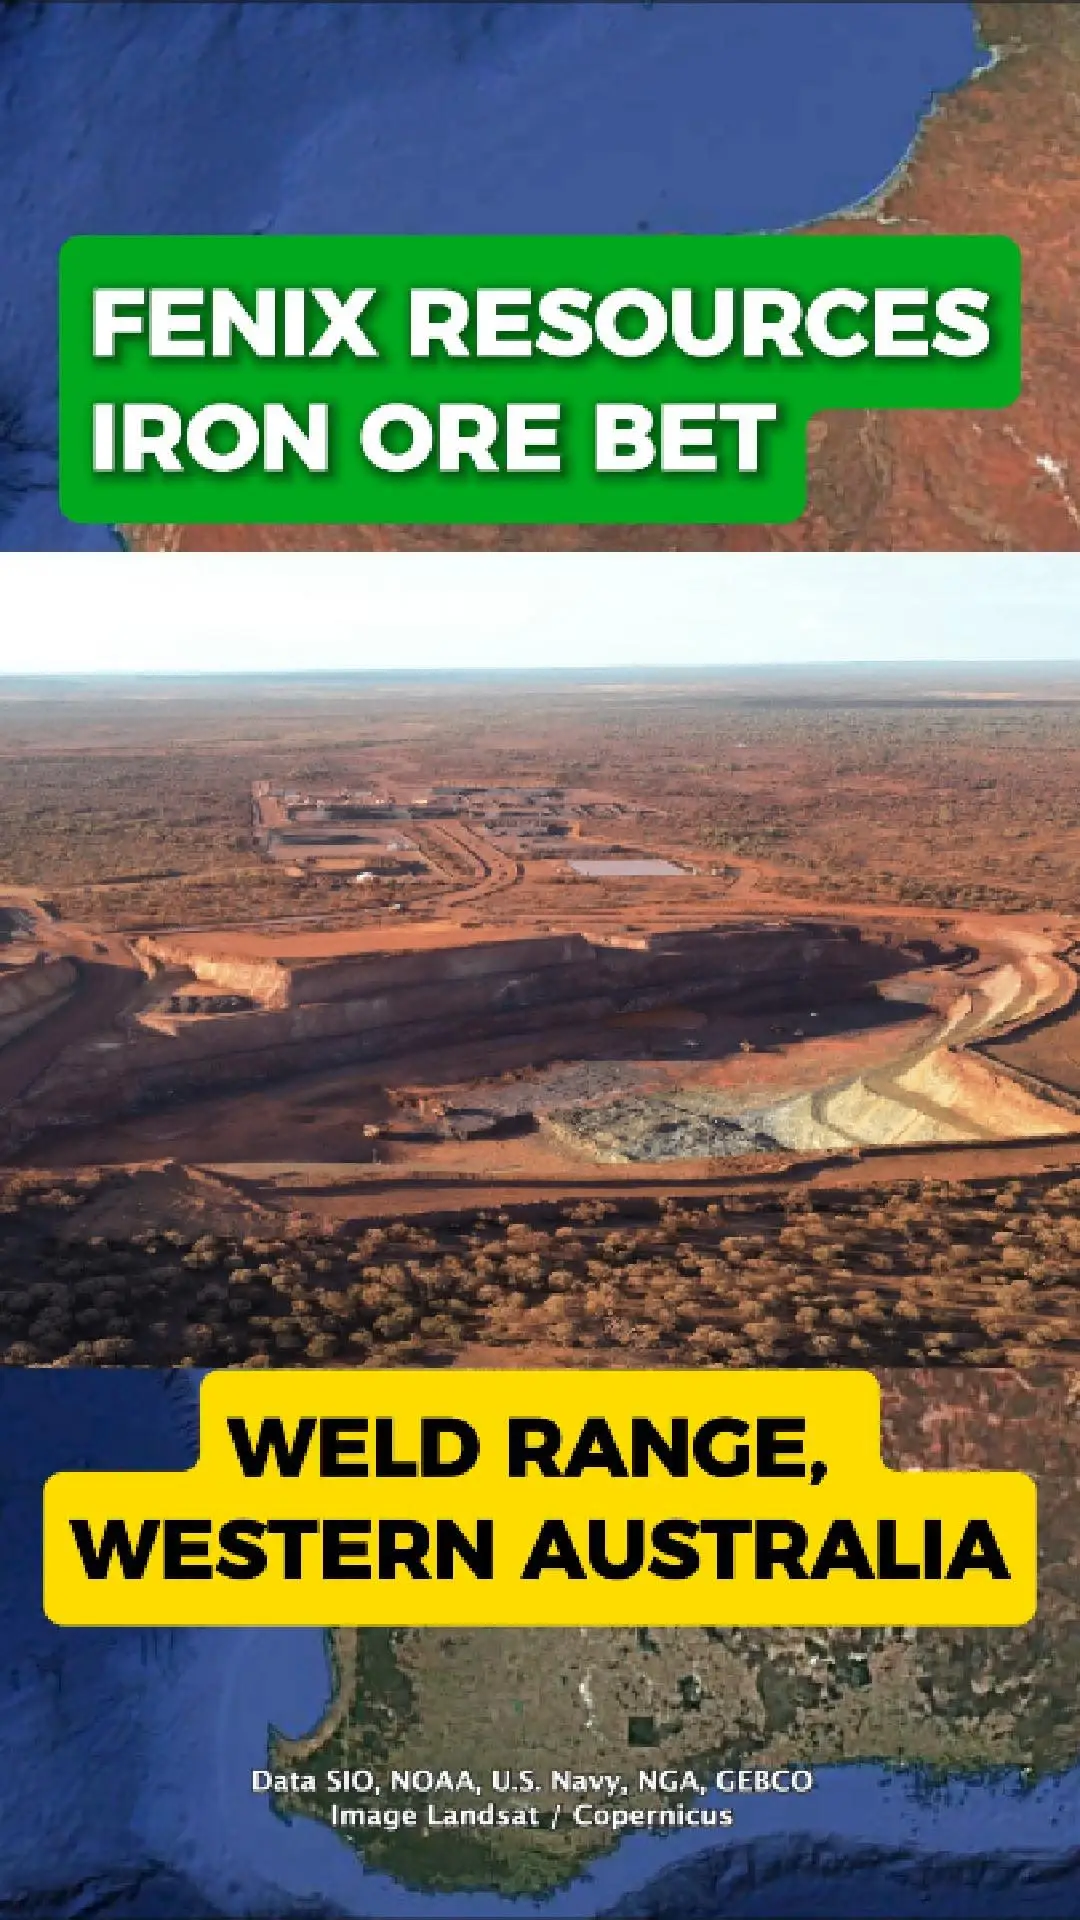
Fenix Shifts Iron Ore Focus To Weld Range
Every Year, Millions Of Tonnes Of Iron Ore Leave Western Australia’S Red Desert, Feeding Global Steel Markets. Now Fenix Resources Is Repositioning Its Iron Ore Operations, Placing The Weld Range At The Centre Of Its Future Production Plans.
As The Company’S Earlier Pits Begin To Wind Down, Fenix Is Moving Toward A More Centralised Approach Focused On Long-Term Stability And Scale.
From Multiple Pits To One Long-Life Hub
The Weld Range Offers Fenix A Long-Life Iron Ore Resource Supported By A 30-Year Mining Agreement. By Concentrating Operations In One Area, The Company Aims To Lift Output While Simplifying Its Production Footprint.
This Shift Marks A Move Away From Shorter-Life Pits Toward A More Sustained Operating Base.
Port Access Underpins The Strategy
A Key Advantage Of The Weld Range Is Its Access To Geraldton Port, Which Supports The Transport And Export Of Iron Ore From Wa’S Mid-West. This Connection Strengthens The Project’S Role In Fenix’S Broader Logistics And Export Strategy.
A Foundation For The Next Phase
With Its Focus Now Turning To The Weld Range, Fenix Is Positioning The Project As The Anchor Of Its Next Phase Of Iron Ore Production. The Strategy Reflects A Broader Push Toward Scale, Efficiency, And Long-Term Continuity.
Whether The Weld Range Becomes The Defining Chapter In Fenix’S Iron Ore Story Will Unfold As The Transition Progresses.
ASX:FEX

Minres Expands Onslow Iron With $3.5b Build
Ken’S Bore Mine Near Onslow Was Once Empty Red Desert. Today, It Sits At The Centre Of One Of Australia’S Largest New Iron-Ore Developments, As Mineral Resources Continues To Scale Up Its Onslow Iron Project In Western Australia.
New Mines, Port And Haul Road
Minres Is Expanding The Onslow Iron Hub With New Mining Areas, A Deep-Water Port And A 150-Kilometre Auto-Haul Road Designed For Autonomous Road Trains. The Infrastructure Forms Part Of A $3.5 Billion Investment Aimed At Building A Large, Long-Life Iron-Ore Operation With Efficient Logistics.
Focus On Cost And Scale
The Project Has Been Designed With Cost Control In Mind. Minres Has Previously Sold A Stake In The Haul Road Infrastructure To Reduce Capital Requirements While Keeping Access To The Critical Transport Corridor.
Competing In A Changing Market
As New Iron-Ore Supply Comes Online Globally, Including From Major Projects In Africa, Minres Is Positioning Onslow Iron To Compete On Cost And Reliability. The Success Of The Project Will Depend On Whether Its Scale And Infrastructure Can Deliver The Low-Cost Edge The Company Is Building Toward.
ASX:MIN
Poll
Popular Stocks 🚀
Show more