T Trillion Energy International…
CSE:TCF
Canada
840


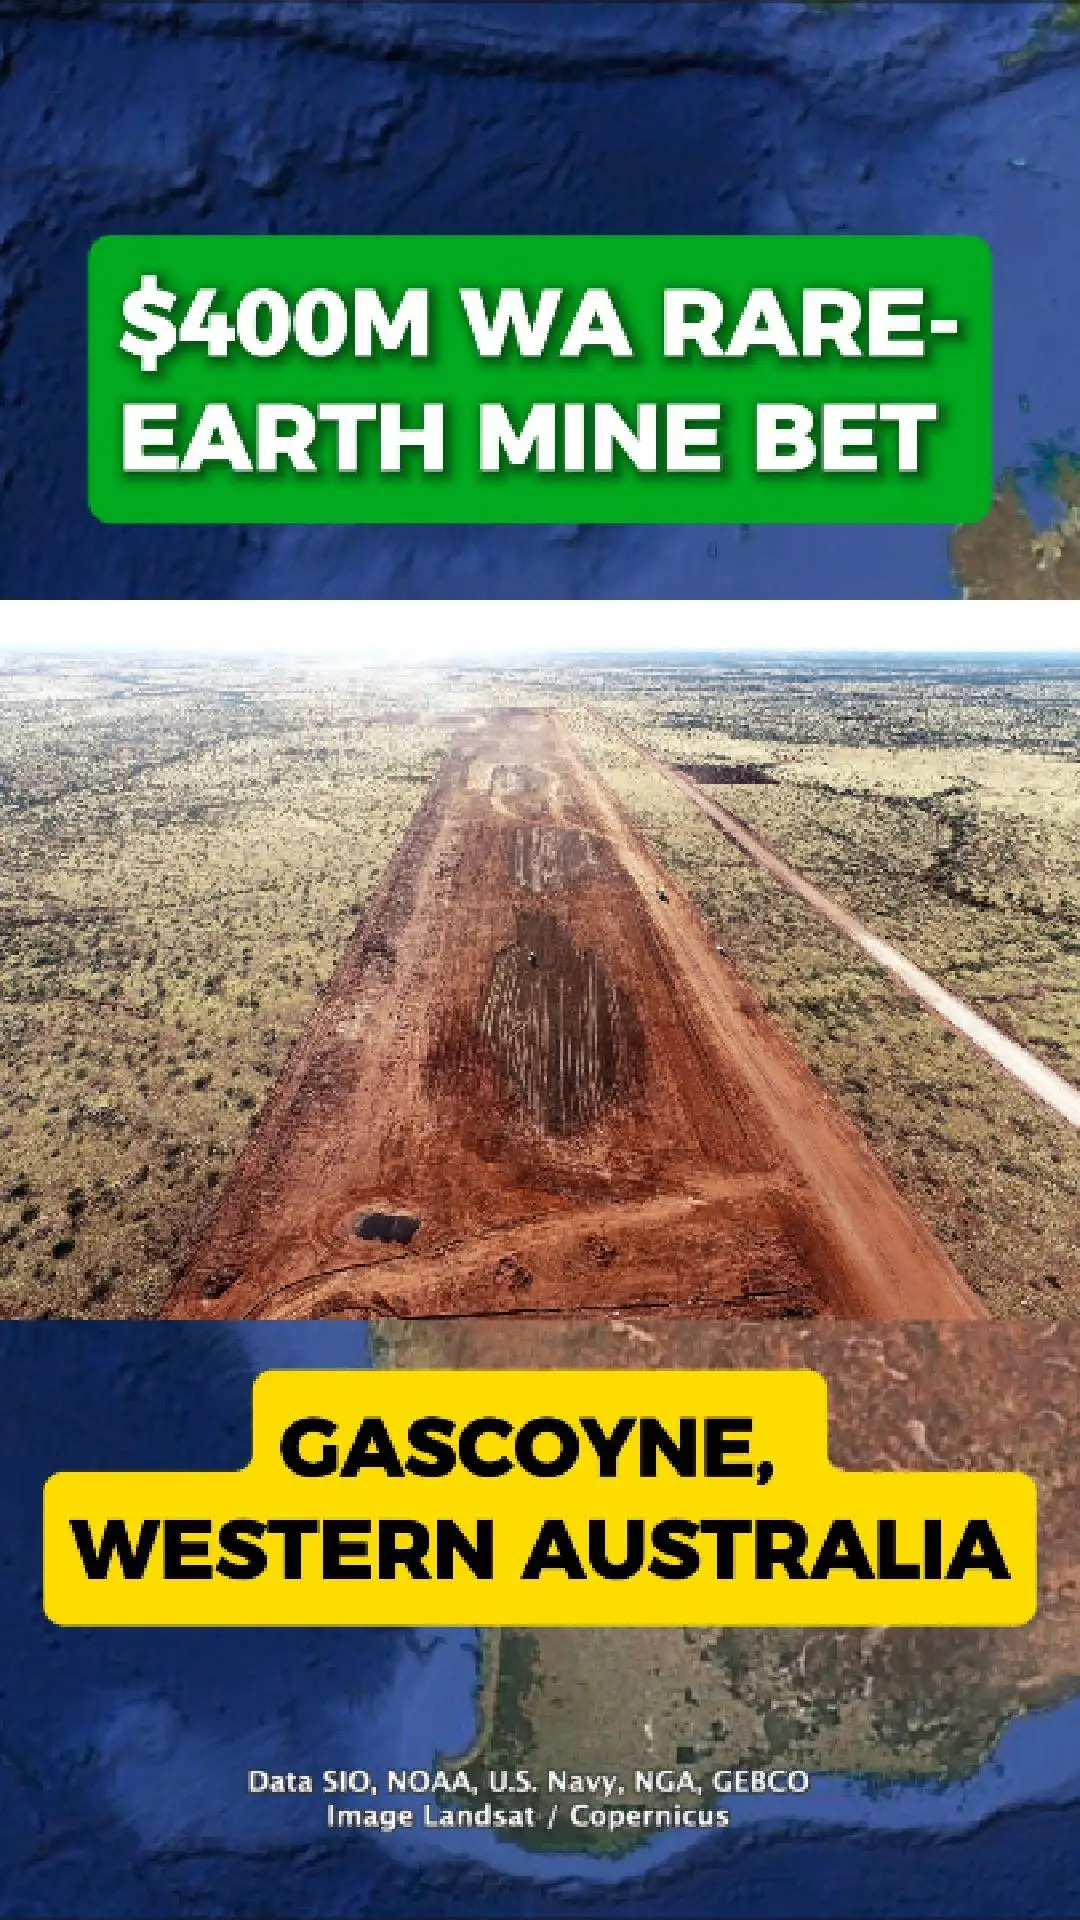
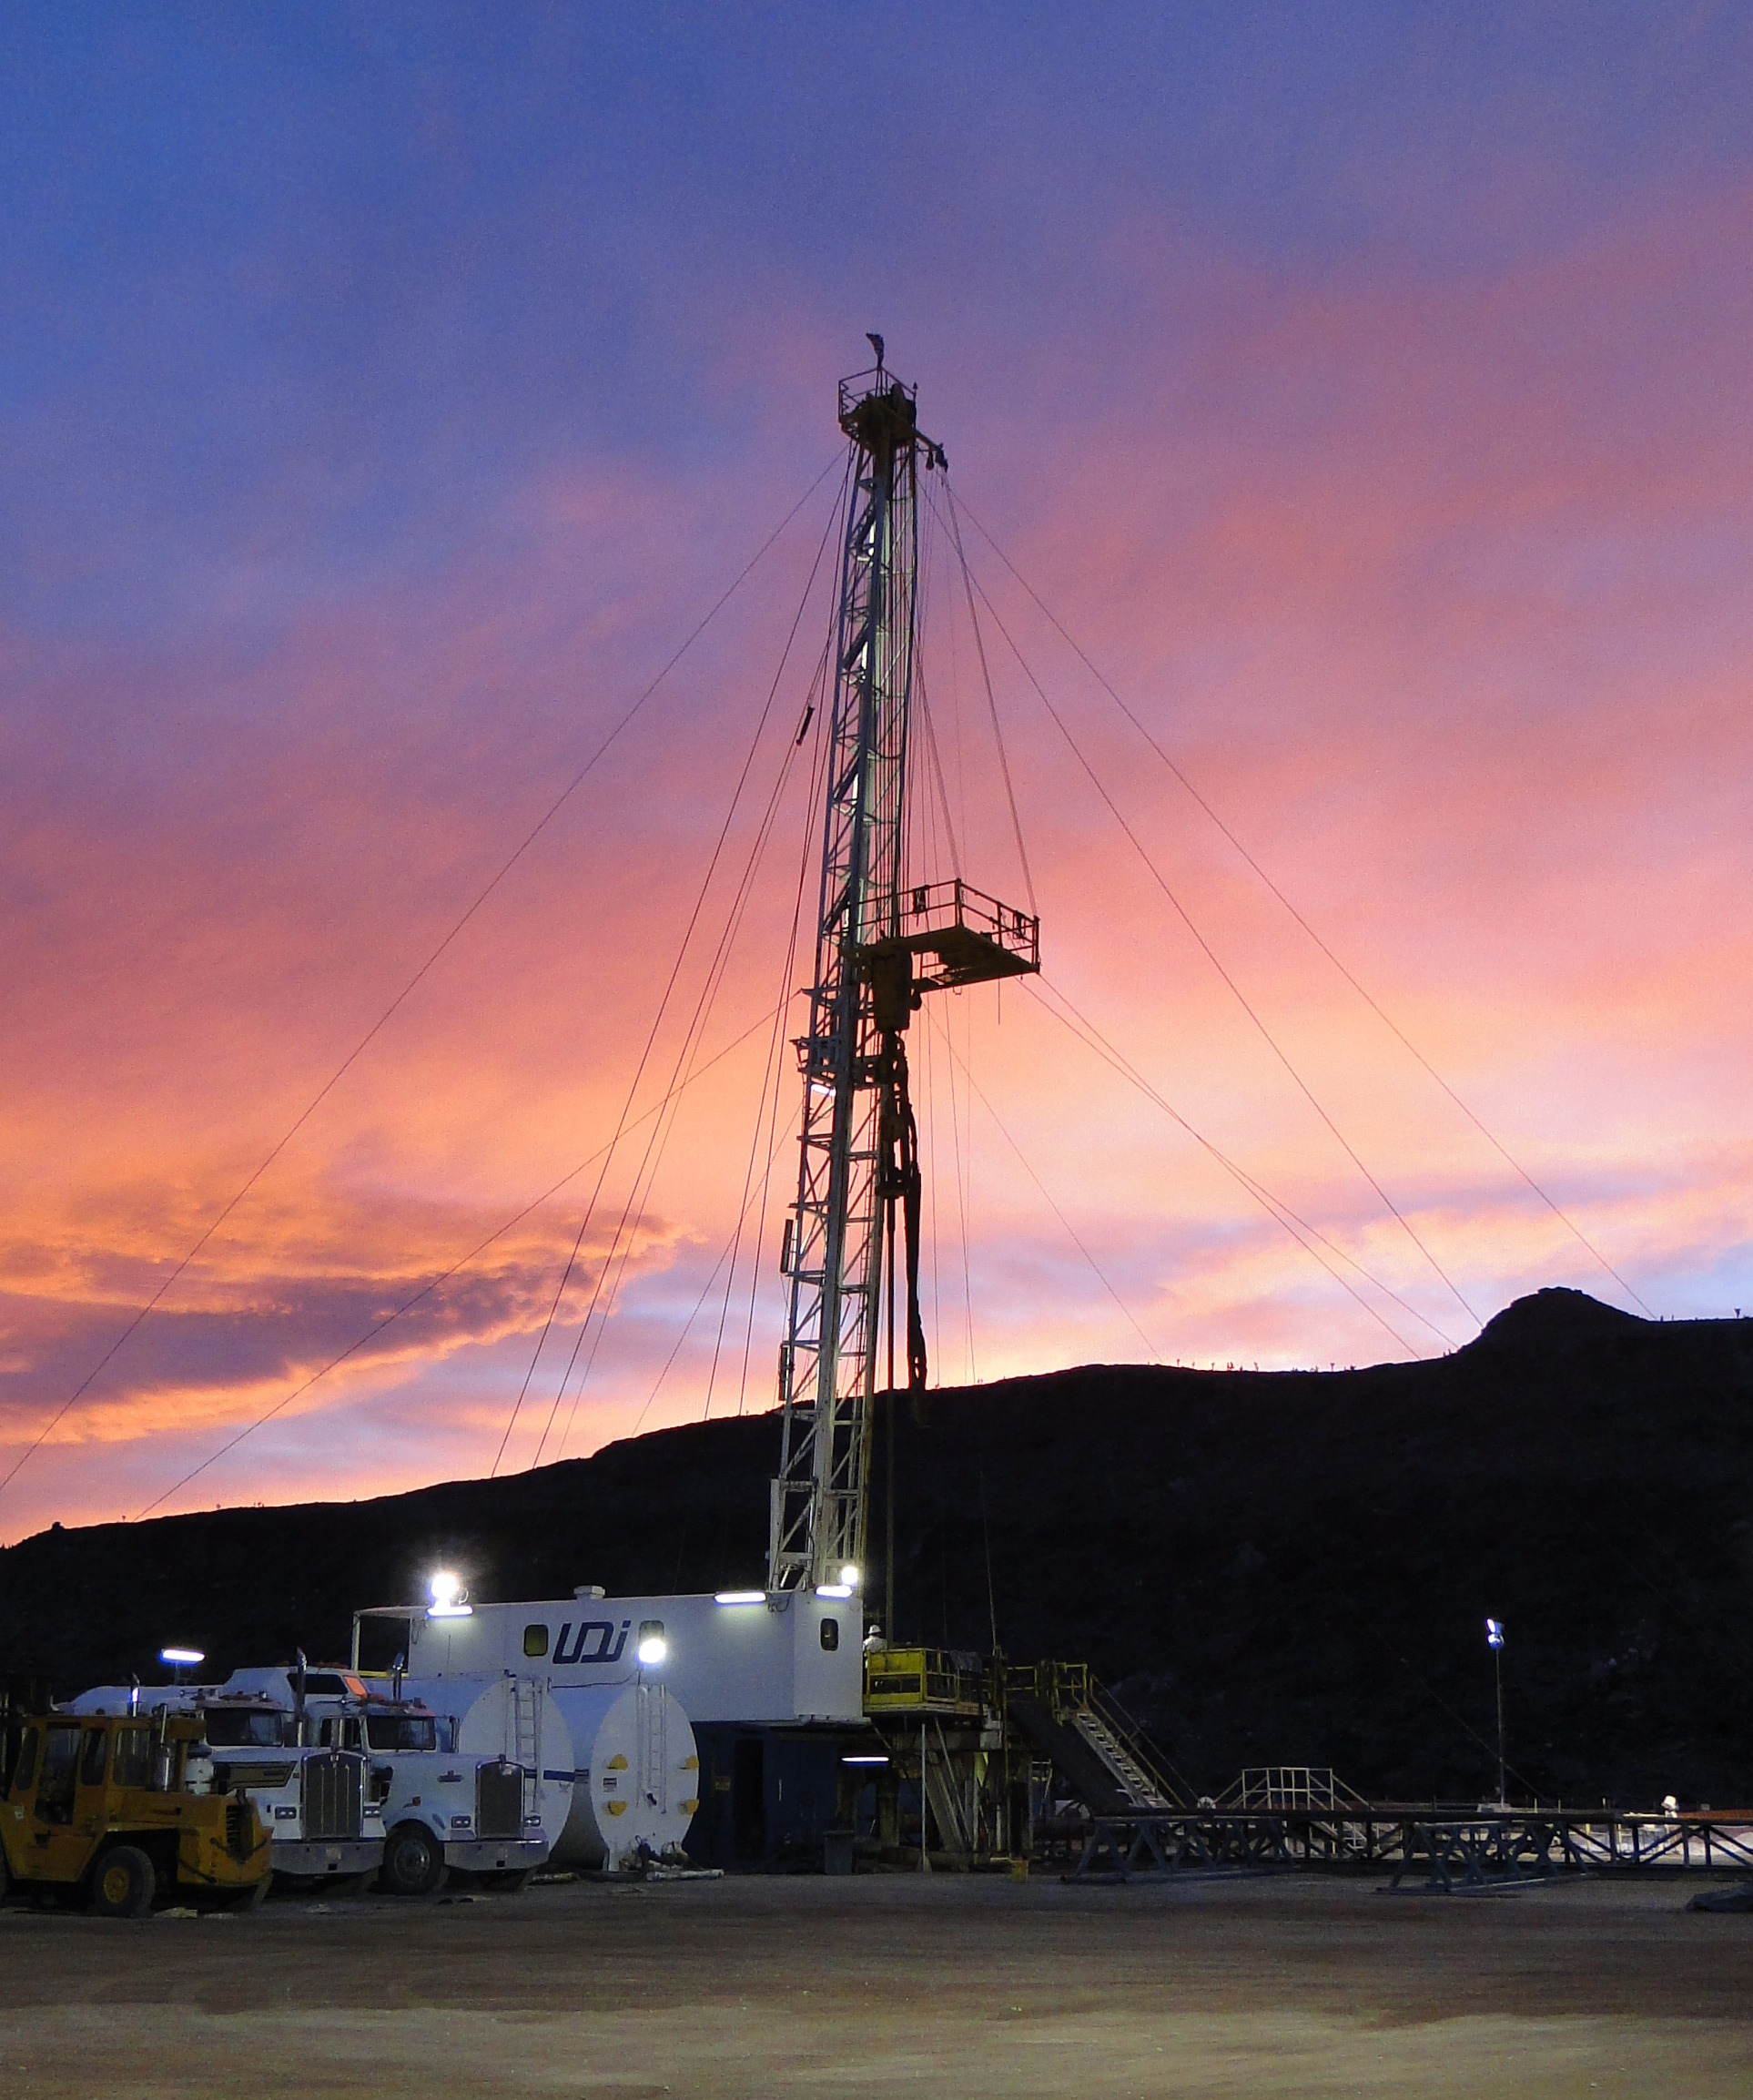
Why Spend Over $400m Building This Wa Rare-Earth Mine?
Around 1,000 Kilometres North Of Perth, The Yangibana Rare-Earths Project Is Aiming To Become One Of Australia’S Key Suppliers Of Neodymium And Praseodymium (Ndpr) — Metals Used In Electric-Vehicle Motors, Wind Turbines And Defence Technology. The Site Sits In The Gascoyne Region, Far From Major Towns But Close To Some Of The Country’S Best Rare-Earth Geology.
Backed By Hastings And Wyloo
The Project Is Being Advanced By Hastings Technology Metals, With Major Backing From Andrew Forrest’S Wyloo. Together They Are Working On A $470 Million Development Plan To Build The Mine And Processing Facilities Needed To Produce High-Grade Concentrate.
A Us Supply Chain In The Making
Yangibana Is Designed To Export Around 37,000 Tonnes Of Rare-Earth Concentrate Per Year. A Key Part Of The Strategy Is Feeding New Downstream Processing Capacity In The United States, As Global Manufacturers Look To Secure Non-Chinese Sources Of Critical Minerals For Clean-Energy Technologies.
Funding Remains The Final Hurdle
While Early Works Have Already Begun And Government Agencies Have Provided Loan Support, The Project Still Needs To Secure Its Remaining Capital Before Full Construction Can Move Ahead. That Leaves A Central Question For Investors And Policymakers Alike: Is Yangibana Finally Close To Becoming A Reality?
 ASX:HAS
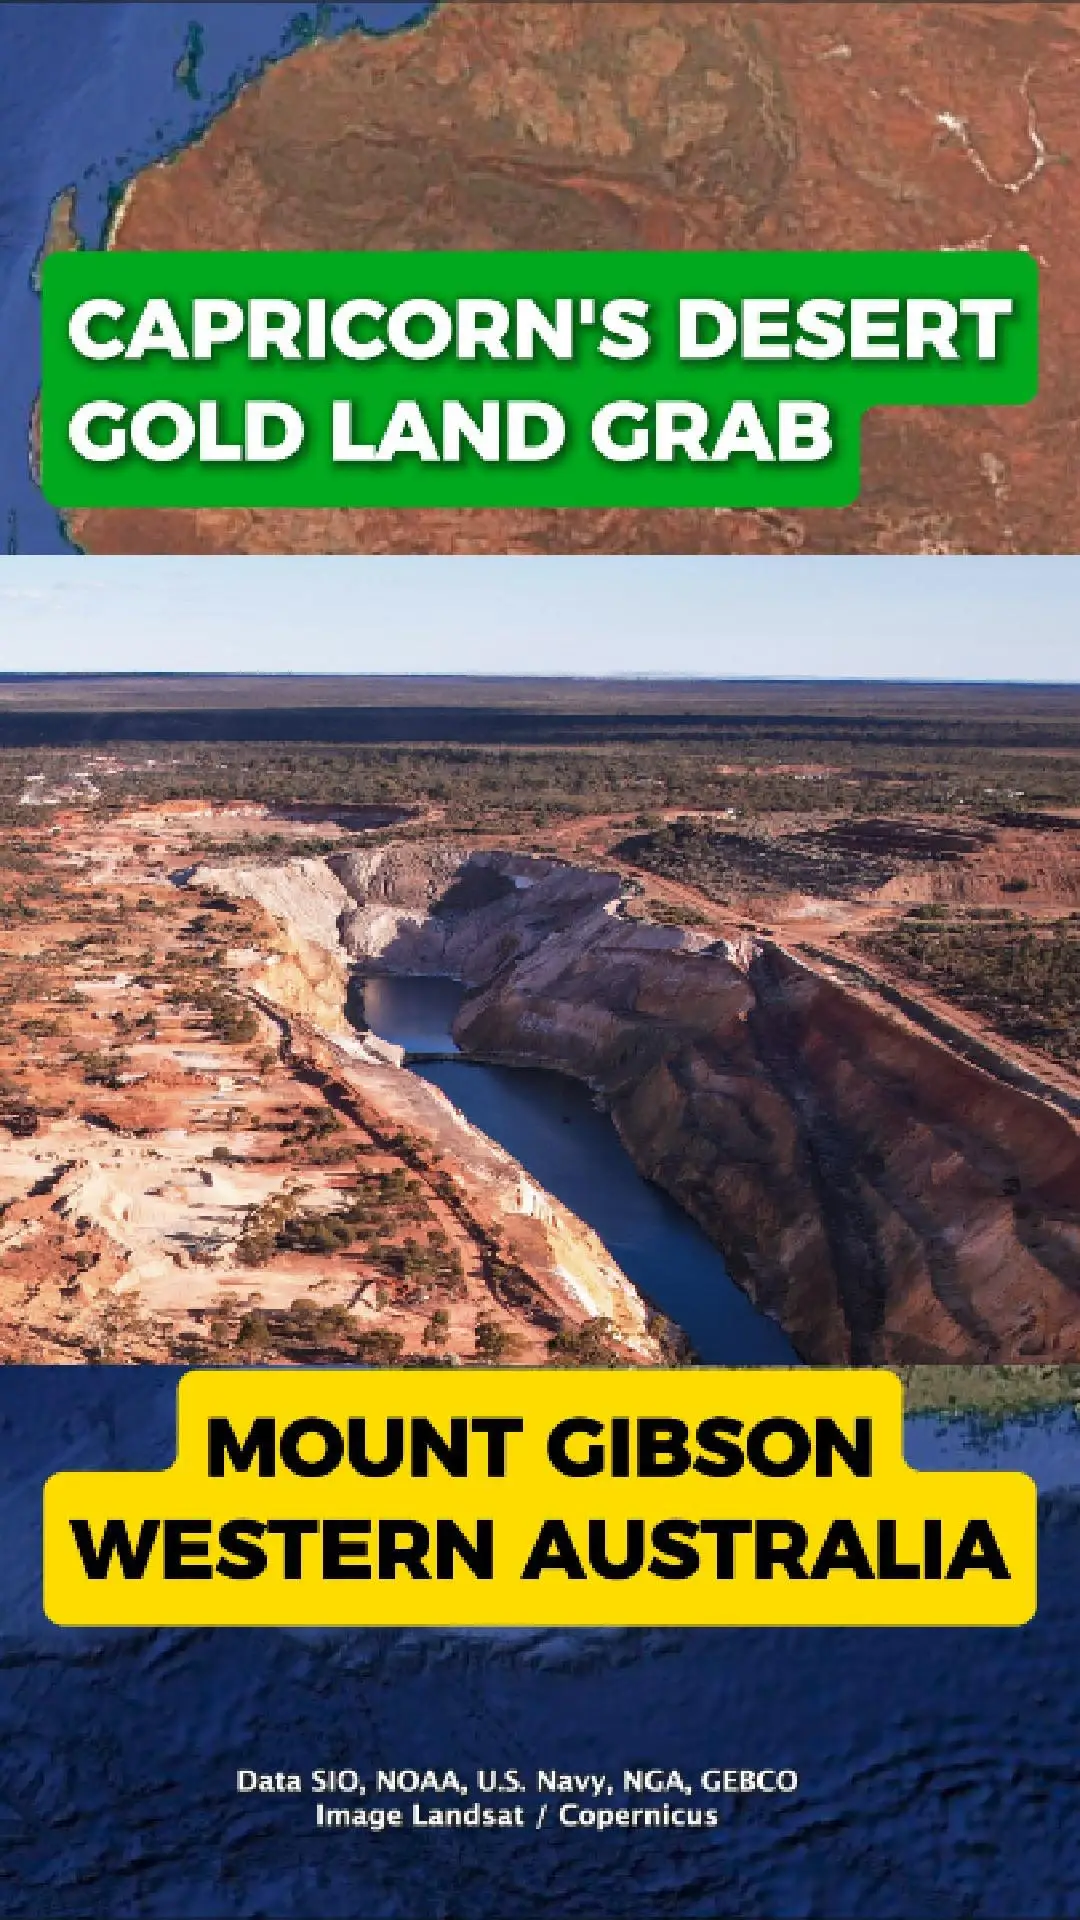
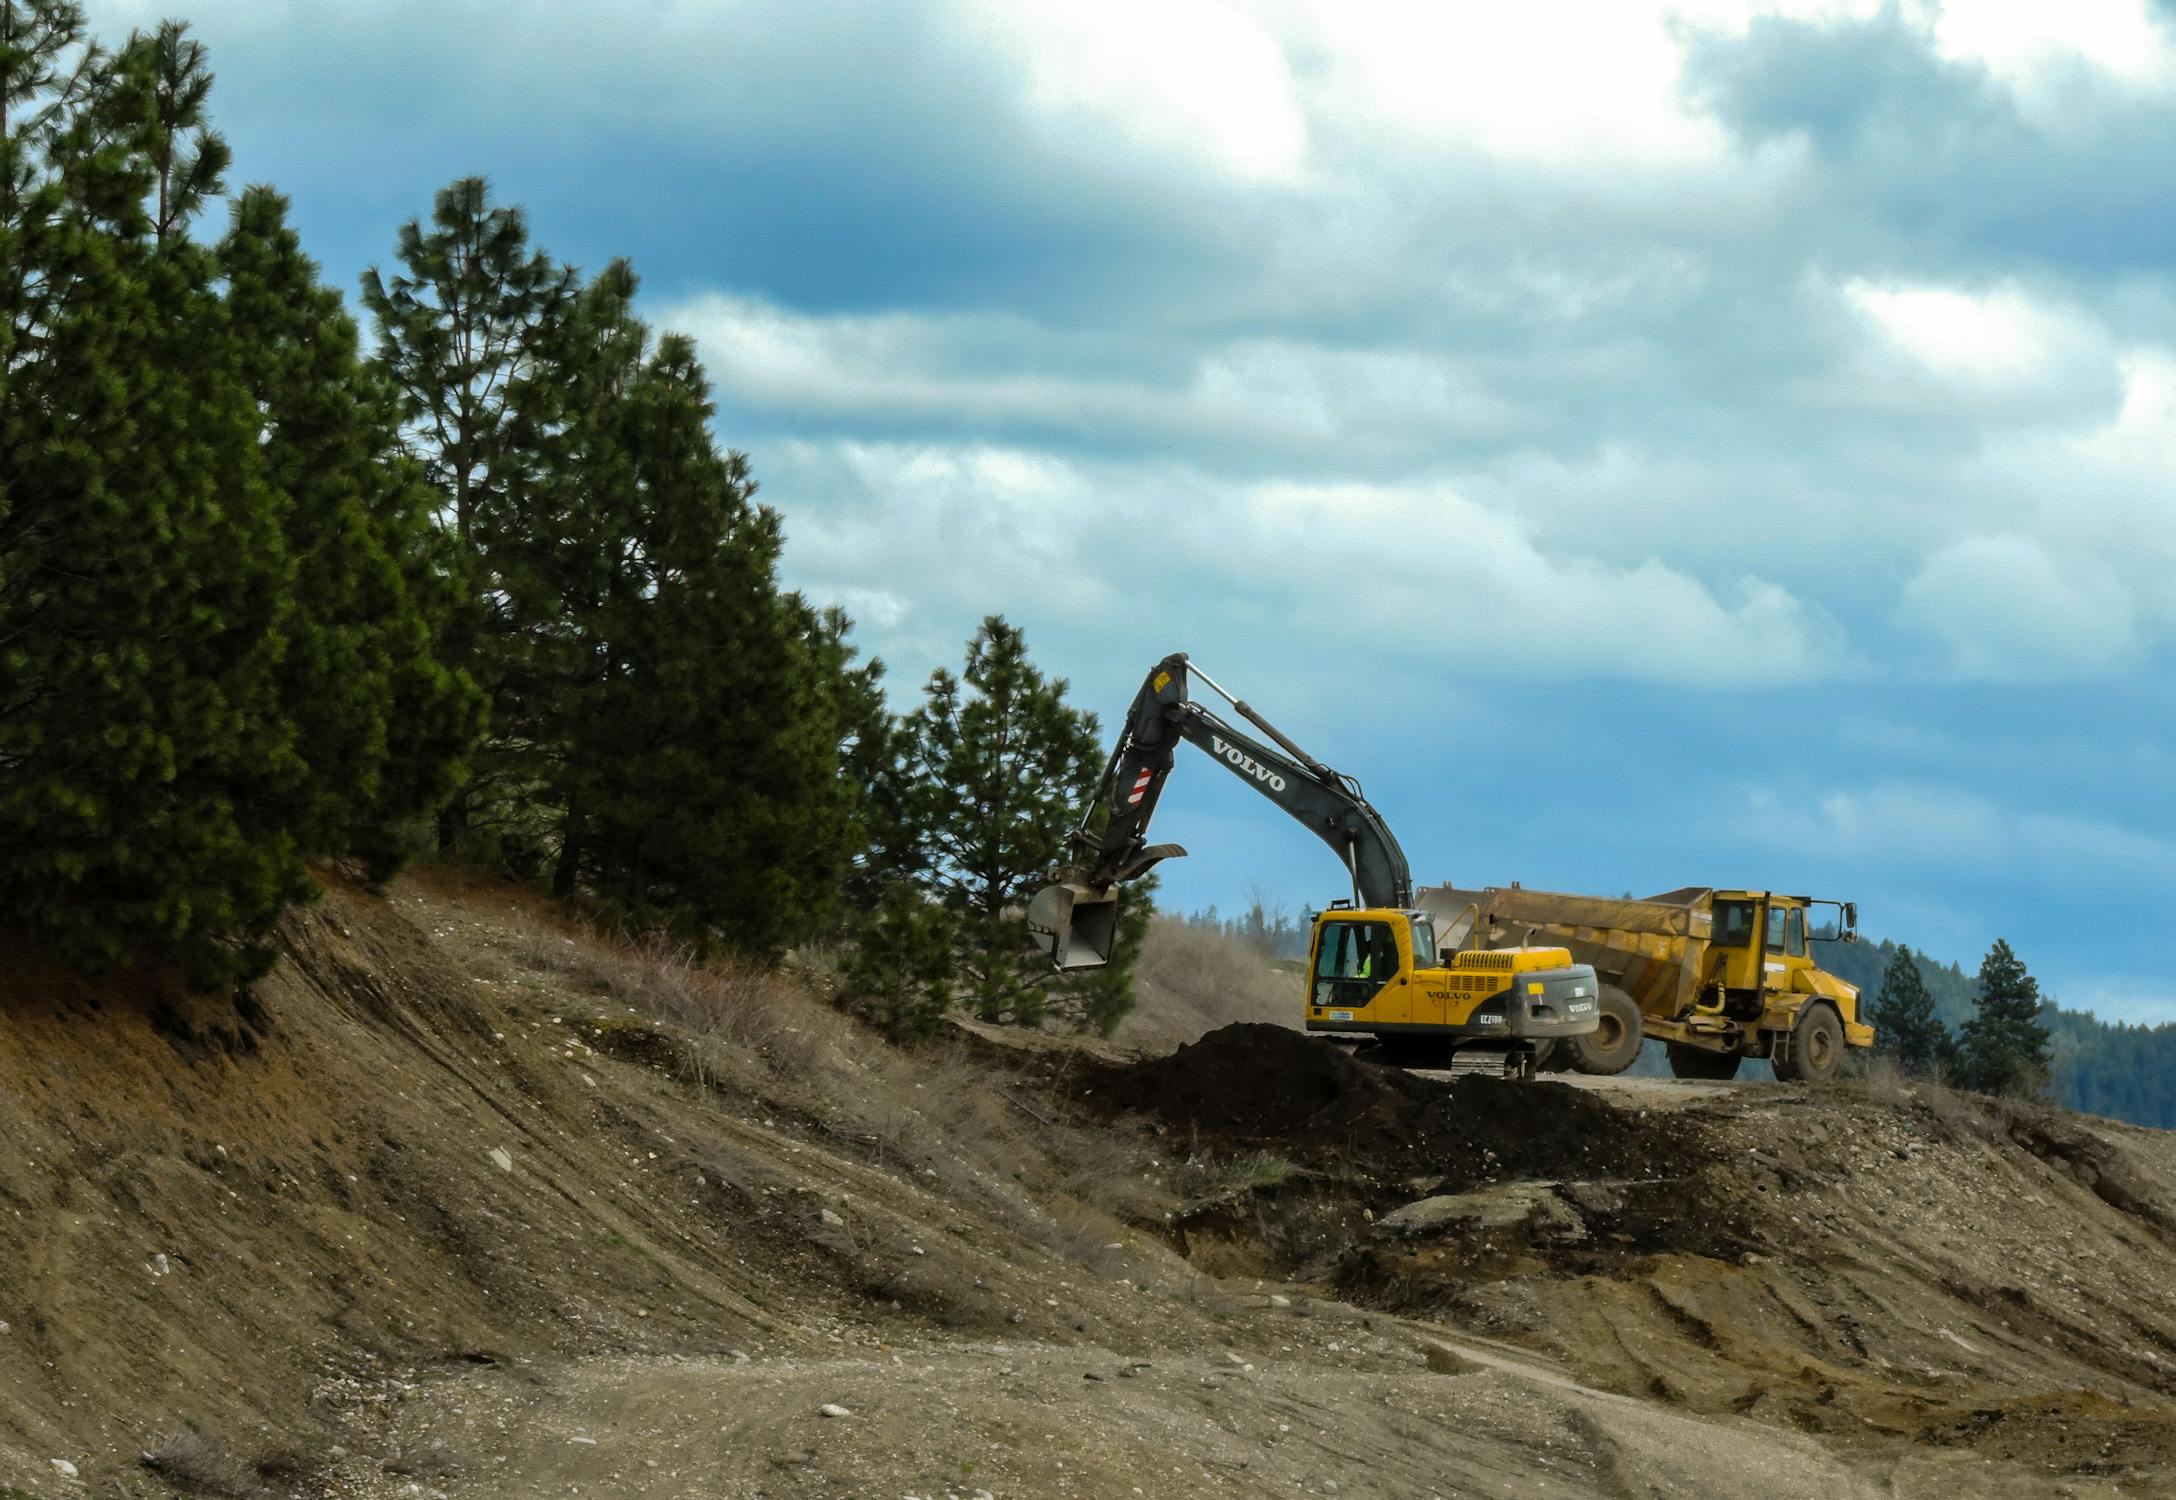
Capricorn Expands In Mount Gibson Gold District
Capricorn Metals Has Made A Low-Key Christmas Acquisition In Western Australia’S Mount Gibson Gold District, Strengthening Its Regional Footprint.
The Company Has Agreed To Buy The Nearby Yalgoo Project For $4.5 Million, Adding Around 1,000 Square Kilometres Of Prospective Ground To Its Existing Exploration Holdings.
Strengthening The Mount Gibson Footprint
The Yalgoo Project Sits Close To Capricorn’S Recently Acquired Golden Range And Fields Find Projects, Both Located Near The Mount Gibson Area. The Land Package Is Considered Prospective For Gold And Copper, With Scope For Future Discoveries.
Rather Than A Short-Term Production Move, The Acquisition Is Aimed At Long-Term Consolidation Across The District.
Focus On Future Ore Supply
Capricorn Has Positioned The Deal As A Strategic Step To Secure Potential Future Ore Sources, Supporting The Long-Term Outlook For Mining Operations In The Mount Gibson Region.
The Acquisition Reflects An End-Of-Year Strategy Focused On Locking Up Ground Early, While Exploration Activity Is Expected To Ramp Up In Future Years.
ASX:CMM
Popular Stocks 🚀
Show more