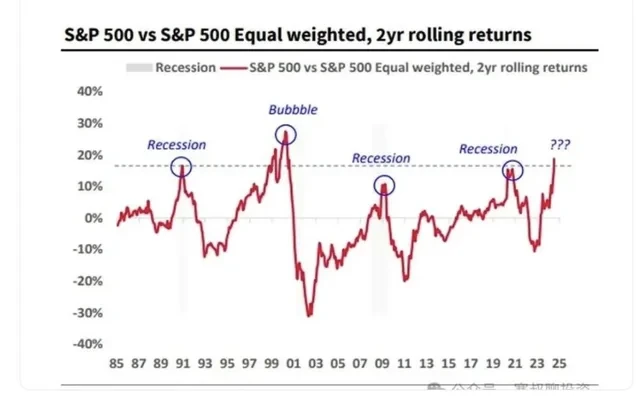
This chart shows how much the biggest companies in the S&P 500 are outperforming the rest.
Every time this gap has hit around 20% in the past 40 years, it’s lined up with big market events — think the ’90s recession, the dot-com bubble, the GFC, and even 2020.
Right now? We’re back near those same highs.


Buffet indicator is showing some wild times ahead perhaps, combine that with Berkshires record high cash hoard of 30%... chart via barchart.com / Longtermtrends

Looks like we're going through something, but who would have thought with all these tarrifs, inflation and trade wars going on

Where does this end up long term with small stocks suffering white giant caps are taking all the coin?

🔺 Student Loan Delinquencies Hit Record 12.9%...
The spike in red reflects financial strain returning fast. Credit card delinquencies are rising too, hinting that lower-income consumers might be nearing a breaking point. What's going on...
The spike in red reflects financial strain returning fast. Credit card delinquencies are rising too, hinting that lower-income consumers might be nearing a breaking point. What's going on...


📈 Top 10 Stock Lists
Join the conversation
📈 Top Daily Gainers
📈 YTD Gainers
📉 Top Daily Losers
💰 High Dividend Yields
📅 Best Performers – November
✅ Seasonal Standouts – November
🔮 Seasonal Standouts – December